IANN Monitor Server & Client Deployment Document – 6.3.3
Pre-requisites:
1. IANN Monitor Server and Client must have communications between each other
2. You need to have admin privileges to perform all the below tasks.
IANN Monitor Server Installation in Windows
a. Elasticsearch Configuration
b. Kibana Configuration
c. IANN Monitor UI Configuration
d. Send Mail and Alert configuration
e. Heartbeat Configuration
f. Encrypt decrypt
1. Download the Server.zip package from S3 bucket and move it to dedicated IANN Monitor server
2. Extract the package Server.zip in the required location
1.1. Elasticsearch Configuration:
1. Download the latest window version of Elasticsearch form the elastic official site by using below link
Link : https://www.elastic.co/downloads/elasticsearch

Note: At present, the latest version available is 8.12.2, and you can conveniently select and download the desired older versions from the official site
2. Extract the package elasticsearch-8.12.2 in the required location
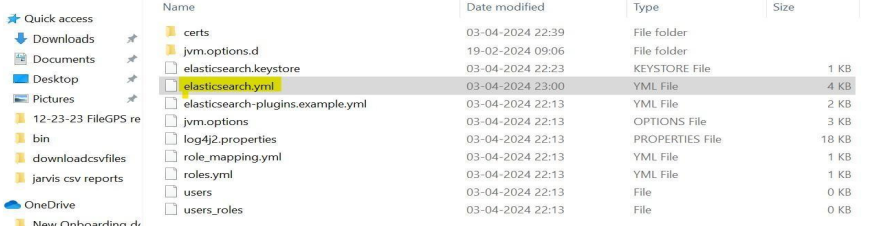
3. Click on Elasticsearch folder and then click on config file.
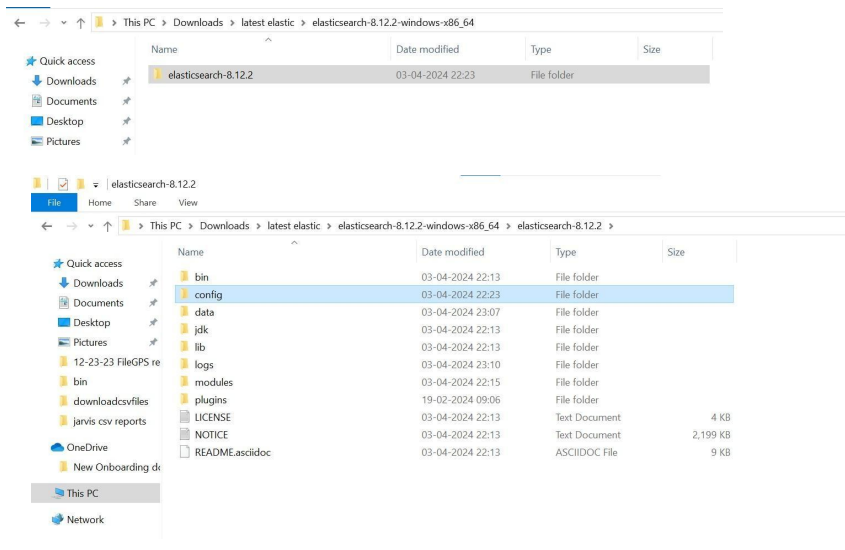
4. Open Elasticsearch YML file with notepad.
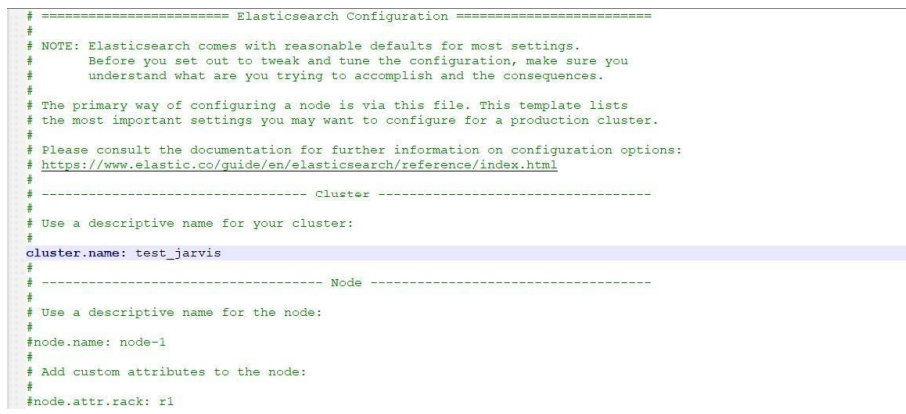
5. Change the cluster name as required, it can be customized cluster.name: test_jarvis
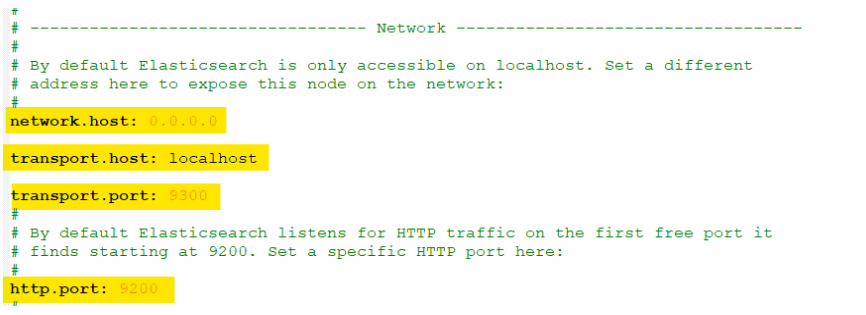
6. Add the below lines in Network session as shown below. network.host: 0.0.0.0 transport.host: localhost transport.port: 9300 http.port: 9200
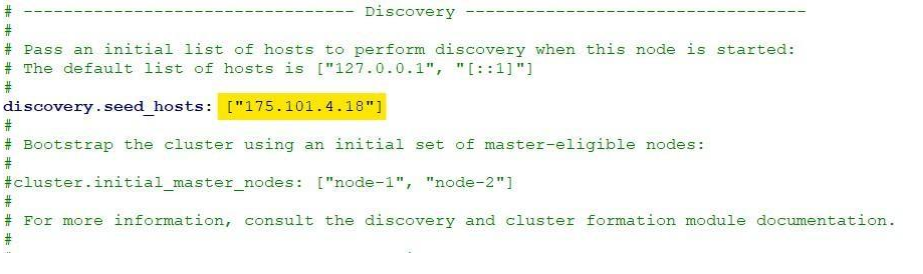
7. Edit the IANN Monitor server IP in Discovery session as shown below.
discovery.seed_hosts: [“175.101.4.18”]
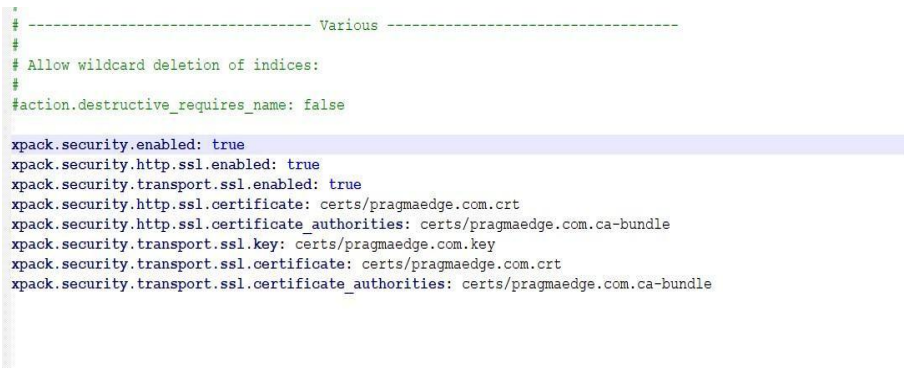
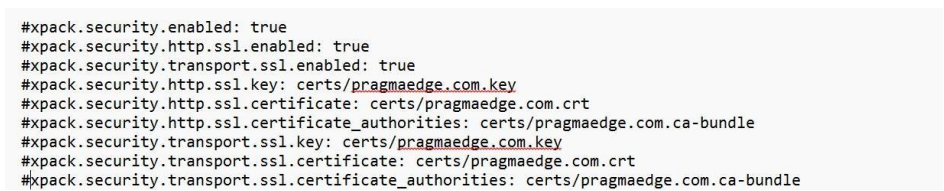
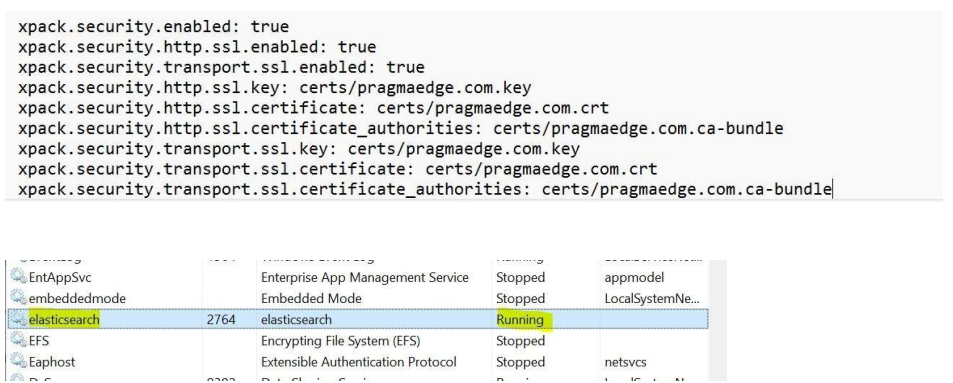
8. Add the below lines at the end of the config file as shown below:
xpack.security.enabled: true xpack.security.http.ssl.enabled: true
xpack.security.transport.ssl.enabled: true xpack.security.http.ssl.key:
certs/example.com.key xpack.security.http.ssl.certificate:
certs/example.com.crt xpack.security.http.ssl.certificate_authorities:
certs/example.com.cabundle
xpack.security.transport.ssl.key: certs/example.com.key
xpack.security.transport.ssl.certificate: certs/example.com.crt
xpack.security.transport.ssl.certificate_authorities:
certs/example.com.cabundle
9. After editing the above config file with required details, save the config file and come back to the elasticsearch8.12.2 folder.
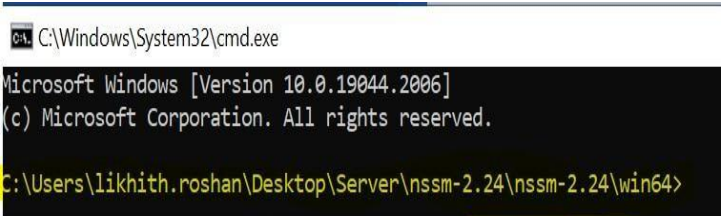
10. To Install Elasticsearch, go back to the nssm folder and open win64 folder. Now select the path and type cmd, it will take you to the command prompt window as shown below.
11. Installing Elasticsearch to services – nssm install elasticsearch
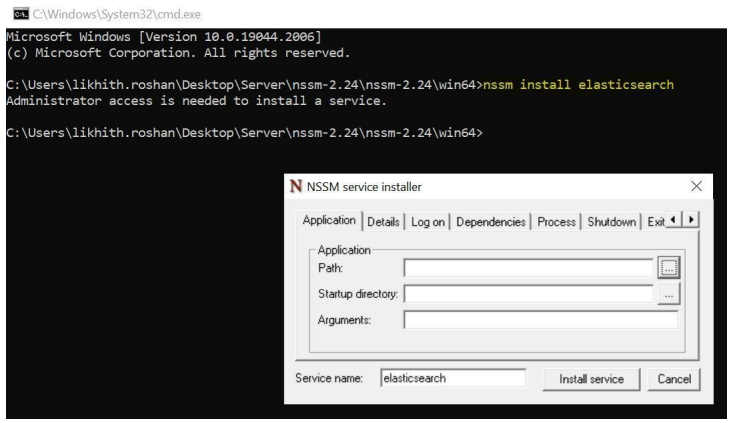
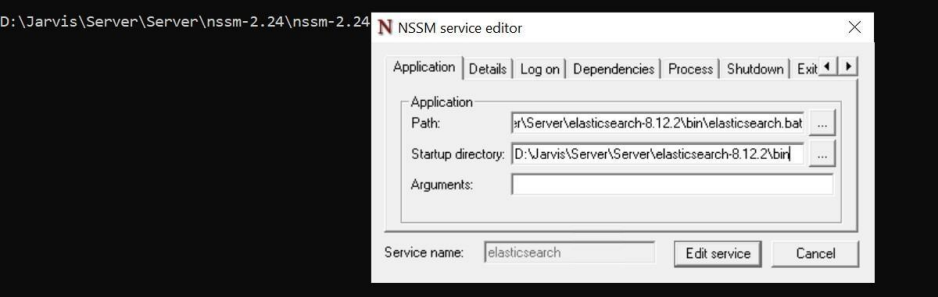
12. Click on the 3 dots and select elasticsearch.bat file, which is present inside the bin folder of Elasticsearch 8.12.2 folder. Now, Elasticsearch service will be installed successfully.
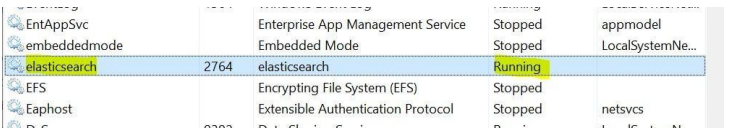
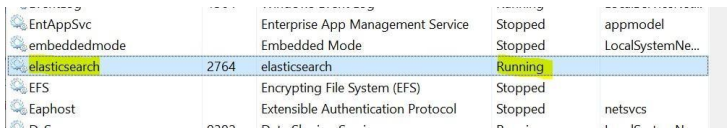
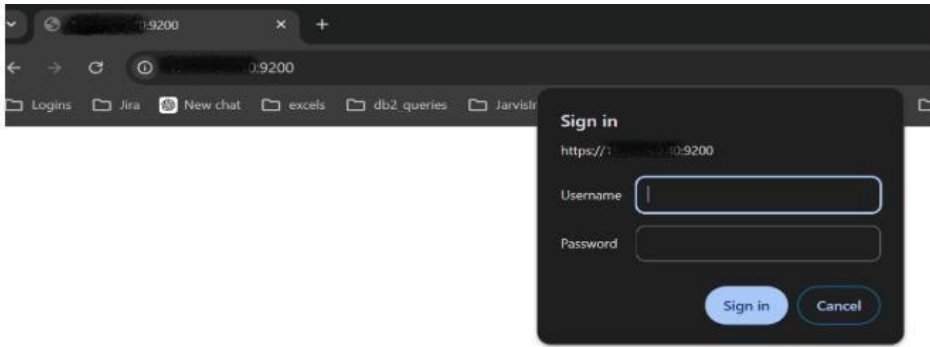
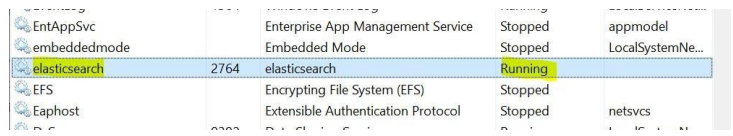
13. To start Elasticsearch, Go to the services in task manager and search for Elasticsearch. Right click on Elasticsearch and then start it, It will come to running state as shown below.
14. Password reset
Comment the following lines in the file elasticsearch.yml (SSL Certs blocks user from resetting password, so we need to comment SSL configuration details). After Commenting, Save the file and restart Elastic Search
15. To restart Elasticsearch, Go to the services in task manager and search for Elasticsearch. Right click on Elasticsearch and then restart it, It will come to running state as shown below.
In the elastic search bin path execute the following command: To reset the password
./elasticsearch-reset-password -u elastic –i
Type ‘y’ after the command and Provide password for elastic user in the terminal as shown below.
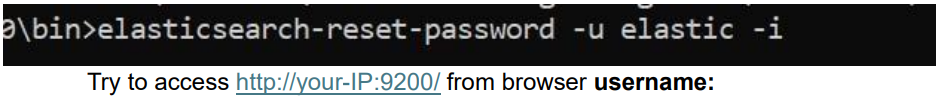
elastic password:< Please provide the updated password that was reset in step 15 >
• Edit the elasticsearch.yml file from elasticsearch location.
/config/elasticsearch.yml
• Uncomment the SSL related Lines from elasticsearch.yml and restart the elasticsearch.
• To restart Elasticsearch, Go to the services in task manager and search for Elasticsearch. Right click on Elasticsearch and then restart it, It will come to running state as shown below.
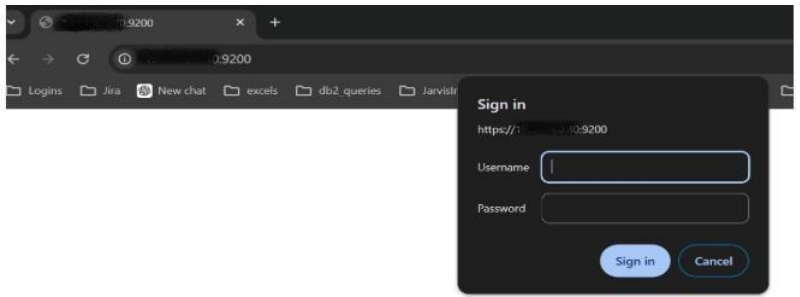
• Finally Try to access https://your-IP:9200/ from browser (eg: https://ec2- 525571- 171.compute 1.amazonaws.com:9200/) Username: elastic password:< Please provide the updated password that was reset in step 15 >
16. Access the elasticsearch URL in the browser as given username and password. https://serverip:9200/ Username: elastic Password:< Please provide the updated password that was reset in step 15 >
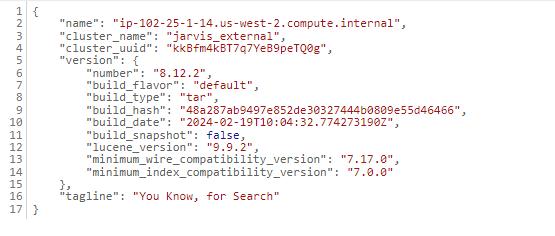
Elasticsearch UI will be in JSON format as shown above.
1.2. Kibana Configuration:
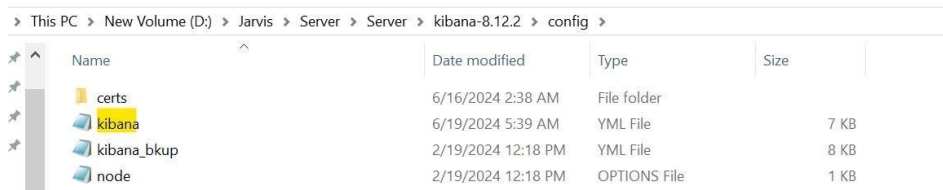
1. In the server folder, you will have Kibana 8.12.2 folder. Open it and go to the config folder. Inside it you will have Kibana.yml file as shown below. Open it with Notepad.
URL to download the kibana 8.12.2 version
https://artifacts.elastic.co/downloads/kibana/kibana-8.12.2-linux-x86_64.tar.gz
To stop Elasticsearch, Go to the services in task manager and search for Elasticsearch. Right click on Elasticsearch and then stop it, it will come to stopped state. Then create a user within Elasticsearch as Kibana won’t accept the default elastic user.
• Execute the below command from terminal of elasticsearch location:
bin/elasticsearch-users useradd kibanauser -p password -r superuser,kibana_admin,kibana_system
Once after user creation, please start the elasticsearch using the step below.
To start Elasticsearch, Go to the services in task manager and search for Elasticsearch. Right click on Elasticsearch and then start it, it will come to running state as shown below.
2. Scroll the kibana.yml file to the bottom and edit the certs path, which is present inside the config folder xpack.security.enabled: true
server.ssl.enabled: true elasticsearch.username: “kibanauser”
elasticsearch.password:
“password” server.ssl.certificate:C:\Users\xyz\Desktop\Server\kibana- 8.12.2 windowsx86_64\ca\ca.crt
server.ssl.key:C:\Users\xyz\Desktop\Server\kibana8.12.2windowsx86_64\ca\ca.key
elasticsearch.ssl.certificateAuthorities:C:\Users\xyz\Desktop\Server\kibana-7.16.2-windows-x86_64\config\certs\client-ca.cer
elasticsearch.ssl.verificationMode: certificate
3. To Install Kibana, go back to the nssm folder and open win64 folder. Now select the path and type cmd, it will take you to the command prompt window as shown below.
To install Kibana – nssm install kibana
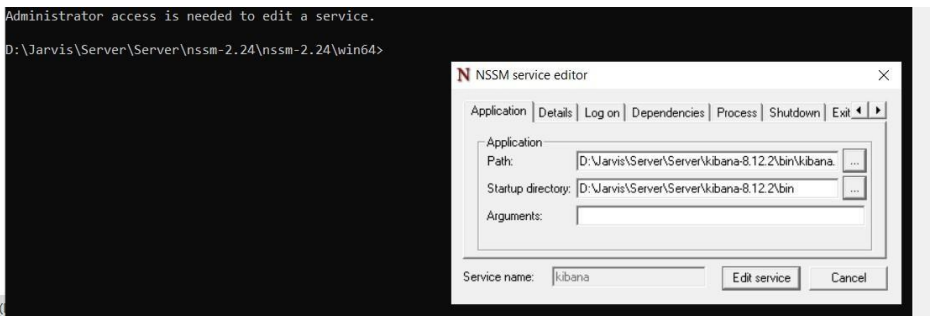
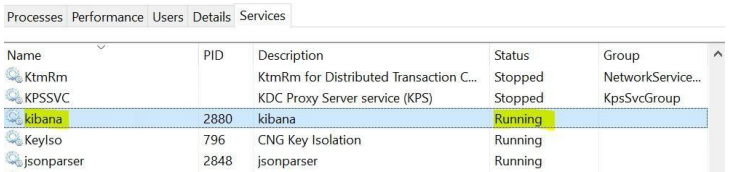
Click on the 3 dots and select Kibana.bat file, which is present inside the bin folder of Kibana 8.12.2 folder. Now, kibana service will be installed successfully. To start Kibana, Go to services in task manager and search for kibana. Right click on the kibana and then start it, it will come to running state as shown below.
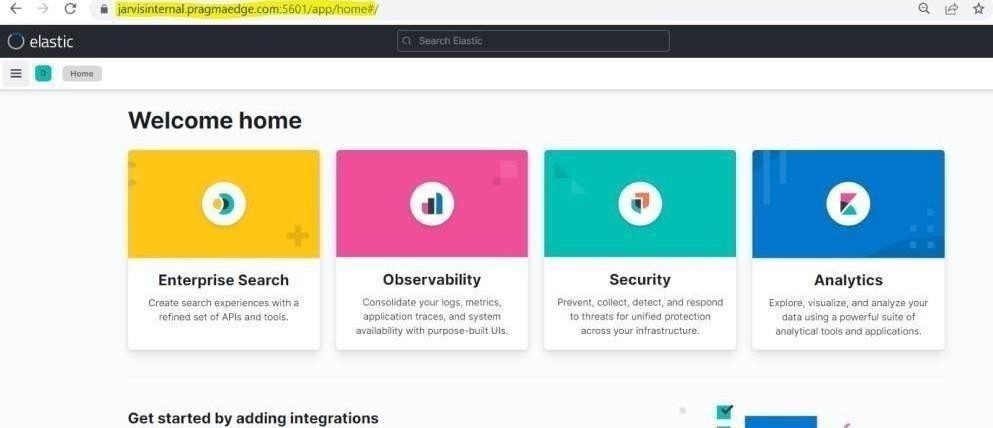
4. Access the kibana URL in browser and give username and password. Username: elastic Password:<<provide the Elasticsearch password> https://serverip:5601/

1.3. IANN Monitor UI
Configurations
1. Navigate to the IANN directory first.
2. Need to check all the Required files are present in the Directory which is mentioned in the below list.
• application.yml
• default_dashboard
• jarvis-dev-okta-metadata.xml.tld
• jarvis-local-okta-metadata.xml.tld
• jarname
• keystore.p12
• pragma.pfx
• privatekey.cer
• Truststore.p12
Below are the configuration changes which need to be done in application.yml file before installing the UI
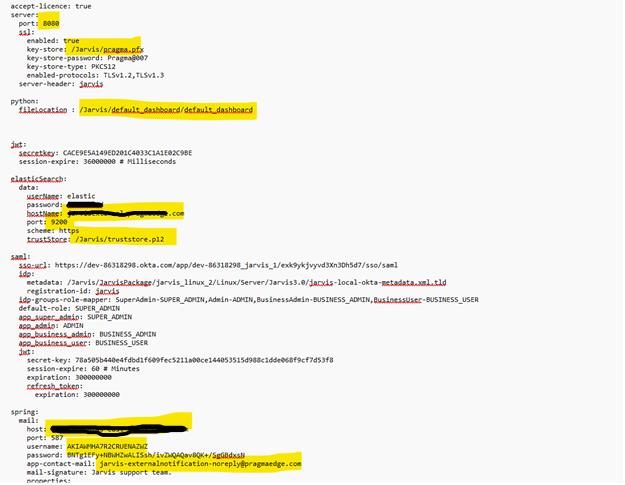
1.3.1. Server
Port: The default port for our application is 8080, and you can specify a customized port number on which you would like to run your application.
1.3.2. Python
Python fileLocation : As part of the setup process, users are required to unzip the provided default dashboard zip file, place its contents into a designated folder, and then provide the path to that file as part of the configuration.
(ex:\python\default dashboard\default_dashboard.exe).
1.3.3. TimeZone
TimeZone format: Here, you will provide the zone format for the data present in your Elasticsearch. Generally, for IANN Monitor we use UTC time zone.
1.3.4. Elastic search
In the data configuration provide your Elasticsearch username, password, port, hostname and trust store file path details.
1.3.4. SMTP Details
The following details are required for SMTP configuration: Host, Port, Username, Password, App contact email, Mail signature.
1.3.5. Saml
SAML makes single sign-on (SSO) technology possible by providing a way to authenticate a user once and then communicate that authentication to multiple applications. If you want to be a saml user. You can enable it with the profile name as saml.
Metadata: Here we provided local okta metadata file with xml.tld extension.
Default Role: By default, we provided a default role is SUPER_ADMIN. And you can change the default role here.
Default Environment: By default, we provided a default environment is DEV. And you can change the default environment here.
Note: You can also change roles for saml in app_super_admin, app_admin, app_business_admin, app_business_user.
In SAML after session out time, it will re-login again, the environment will be switched to the starting Environment provided from the API response, not the environment we are in
1.3.6. JWT
Session-expire: Here, you are required to provide a customized time in milliseconds for the duration of your SAML profile application login.
Expiration: Here, you are required to provide a customized time in milliseconds for the duration of your application login.
NOTE: Here Expiration is for JARVIS profile and Session-expire is for SAML profile. Command to start your application with Jarvis user:
java -Dspring.profiles.active=saml -jar YOUR JAR NAME.jar –
spring.config=application.yml
java -Dspring.profiles.active=jarvis -jar YOUR JAR NAME.jar –
spring.config=application.yml
1.3.7. Default User
Here, you need to provide user details to create a default user in this application.
UserId
FirstName
LastName
PhNo
EmailId
Status
Password
Role
Saml
RefreshToken
1.3.8. Deployment
Once application.yml changes are done. We can run the package with the below command using command prompt. Command for normal profile: java -Dspring.profiles.active=jarvis -jar
JES.Jarvis.jar
Command for SAML profile: java -Dspring.profiles.active=saml -jar
JES.Jarvis.jar
Need to update the command based on the Jar name.
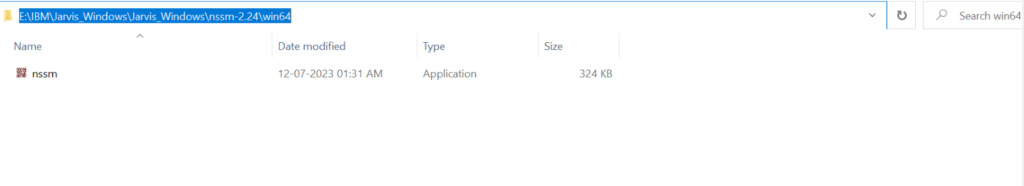
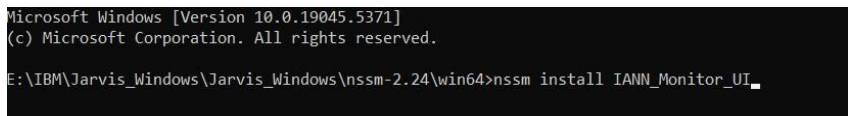
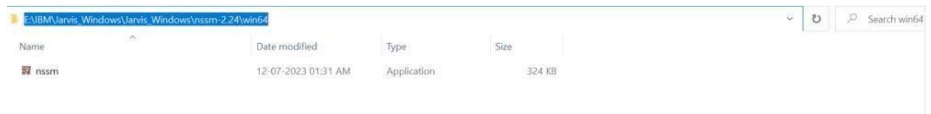
1. Go to the folder nssm-2.24 and select win64 and select path and enter cmd

2. Enter the command nssm install IANNMonitorUI
3. Click on yes
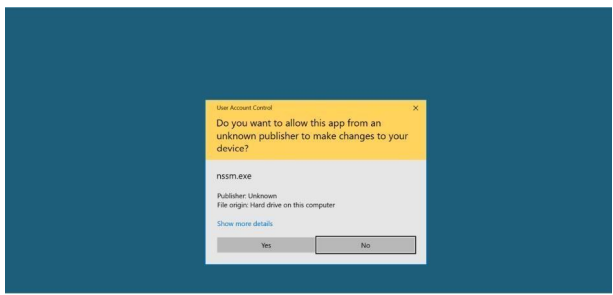
4. You will get a pop up of nssm for creating a service
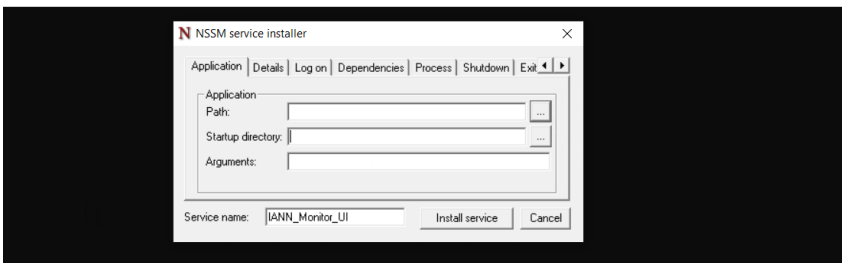
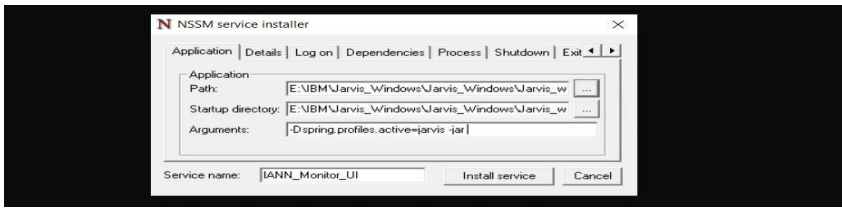
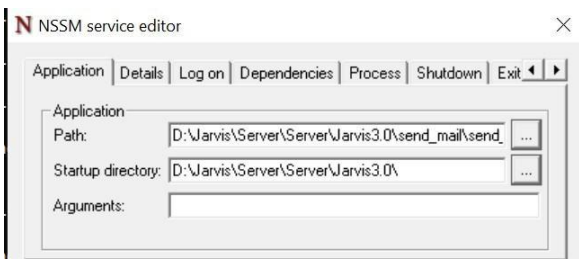
5. Select IANN Monitor UI jar location at startup column. Select java.exe (java/bin) file location in path column and provide – Dspring.profiles.active=jarvis -jar in argument location as below and then click on install service.
6. Open task manager and then go to the services
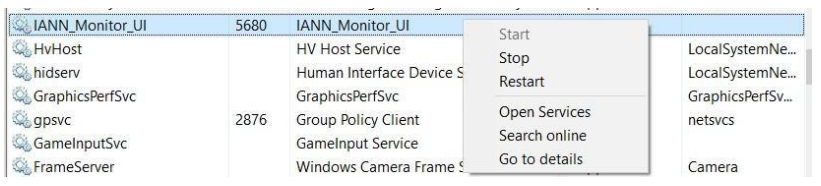
7. Search for IANN_Monitor_UI and check whether it is running or not .FYR:
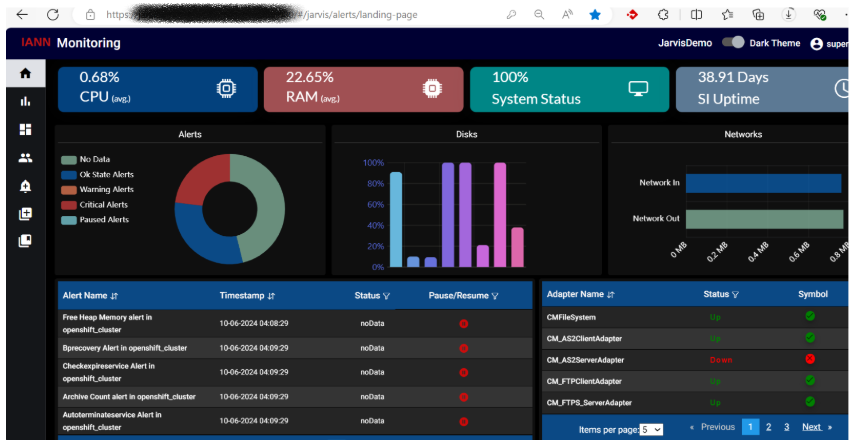
8. Examine the IANN Monitor UI jar logs and attempt to access the Ui URL to see if the IANN Monitor UI is functioning properly. Once the application is up and running try accessing the URL of UI.

Default credentials: username:superadmin
Password: Expl0re
1.4 Send Mail and Alert Configuration:
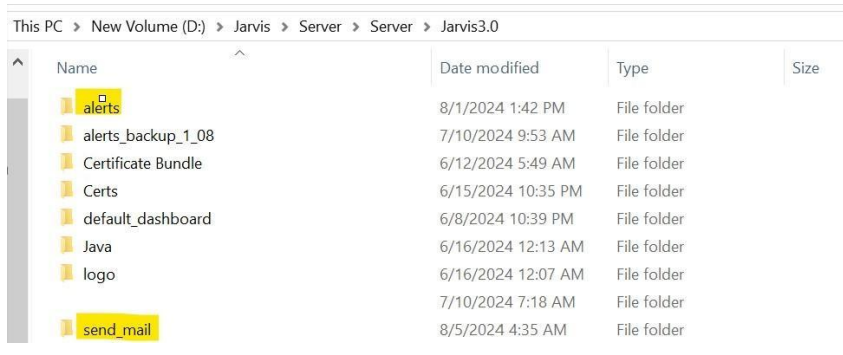
1. Go to the jarvis3.0 folder we can be able to see alerts and send mail packages as shown in the below
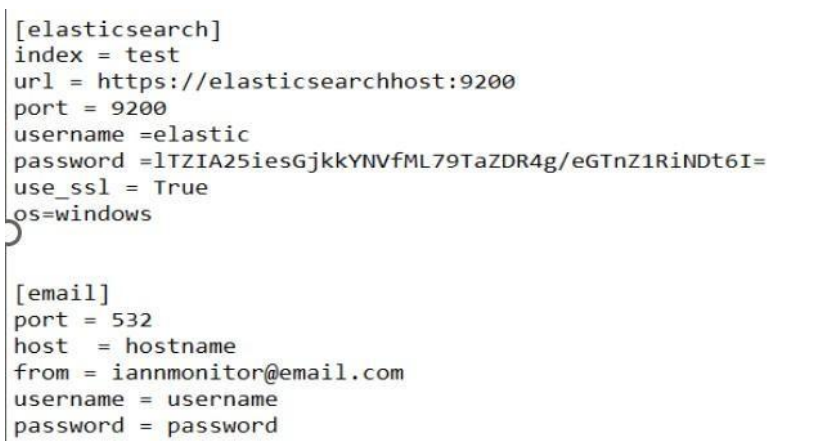
2. Edit the config.ini file as shown in the below mentioned required details elastic search details. And SMTP details under email. Once the config Chages are done.
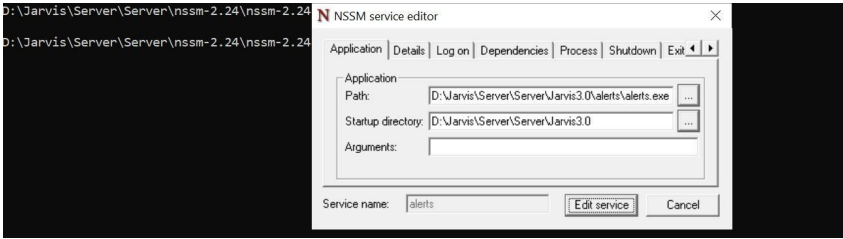
3. To Install alerts and send mail package, go back to the nssm folder and open win64 folder. Now select the path and type cmd, it will take you to the command prompt window as shown below.
4. Enter the command below: nssm install alerts
5. nssm install sendmail
6. To start alerts and Sendmail, Go to services in task manager and search for alerts and Sendmail. Right click on the alerts and sendmail and then start it, it will come to running state as shown below.

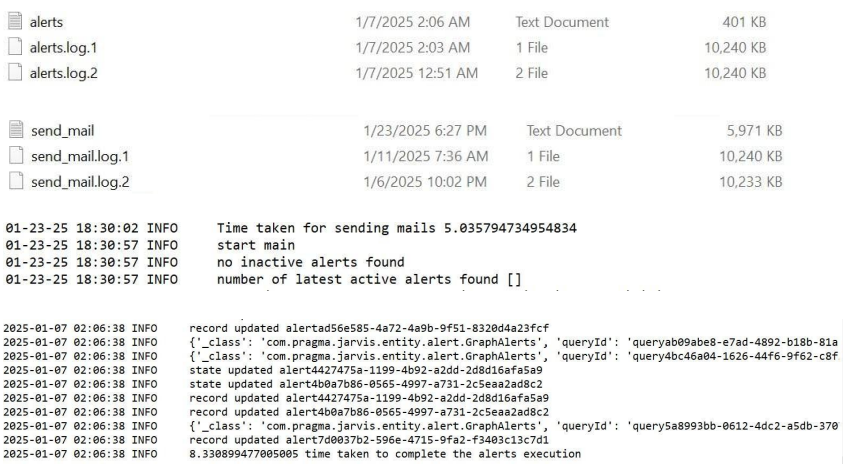
7. Go to the alerts and send mail package location and open the “alert.log” and “send_mail.log”text document and verify the logs for any errors or exceptions and then validate the time of the logs with the current time
1.5 Heartbeat and Systemstats Configuration:
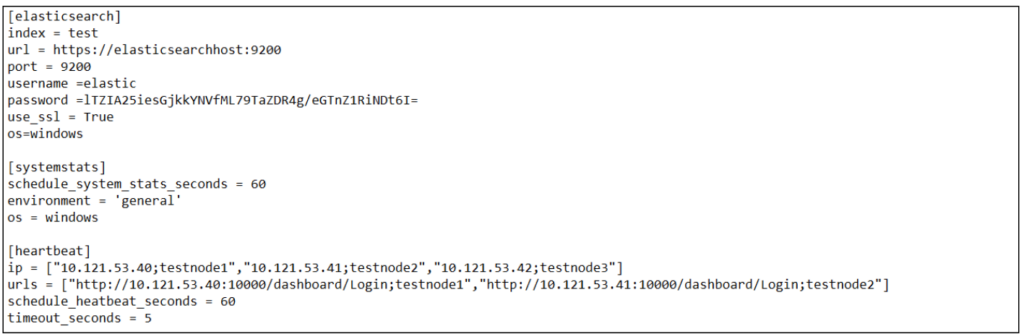
1. Go to config file which is present in the Server folder with notepad. Edit the config.ini file with the required IP’ s and URL’ s which need to be tracked as shown below
[elasticsearch] index = jarvis # index name
can be customized url = https://:9200/ # elasticsearch
URL port = 9200 # elasticsearch
port username = elastic # elasticsearch
username password = nIeF3ZyDLxefyYpCR2zlrlB7QZyW48S/QrCdwS4eLz8= #elasticsearch encrypted password ( to encrypt the password refer below) use_ssl = true
[systemstats] schedule_system_stats_seconds = 60 [heartbeat] ip = [“ip:servername”] # Provide IANN Monitor Client IP’s which nee
1. Go to config file which is present in the Server folder with notepad. Edit the
config.ini file with the required IP’ s and URL’ s which need to be tracked as
shown below
[elasticsearch] index = jarvis # index namecan be customized url =
https://<serverip>:9200/ # elasticsearch
URL port = 9200 # elasticsearch port
username = elastic # elasticsearch
username
password = nIeF3ZyDLxefyYpCR2zlrlB7QZyW48S/QrCdwS4eLz8=
#elasticsearch encrypted password ( to encrypt the password refer
below) use_ssl = true
[systemstats]
schedule_system_stats_seconds = 60
[heartbeat]
ip = [“ip:servername”] # Provide IANN Monitor Client IP’s which
needs to be tracked
urls = [“url:urlname”] # Provide IANN Monitor client URL’s which
needs to
be Tracked
schedule_heatbeat_seconds = 60 timeout_seconds
= 5
2. Now, save the file after editing it with required details.
ds to be tracked urls = [“url:urlname”] # Provide IANN Monitor client URL’s which needs to be Tracked schedule_heatbeat_seconds = 60 timeout_seconds = 5 2. Now, save the file after editing it with required details.
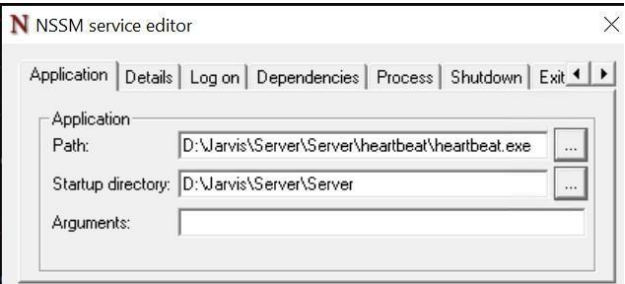
3. To Install Heartbeat, go back to the nssm folder and open win64 folder. Now select the path and type cmd, it will take you to the command prompt window as shown below
4. Click on the 3 dots and select Heartbeat file, which is present inside the server folder and click on OK. Now, heartbeat Service will be installed successfully.
5. To start Heartbeat, Go to services in task manager and search for heartbeat. Right click on the heartbeat and then start it, it will come to running state as shown below

6. To Install systemstats, go back to the nssm folder and open win64 folder. Now select the path and type cmd, it will take you to the command prompt window as shown below.
1.6 Teams and Slack Integration:
1. Go to the jarvis3.0 folder we will be able to see Teams and slack packages.
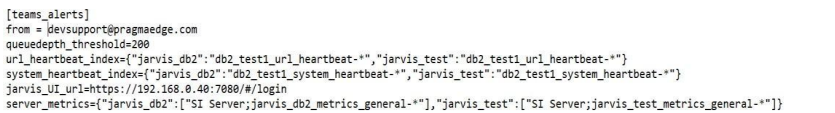
2. Below are the changes to be made in config.ini.
• From – Specify the email ID from which notifications should be triggered.
• Queuedepth_threshold – Define the threshold value. Any queue exceeding this threshold will trigger a notification in Teams/Slack.
• Url_heartbeat_index – Provide the environment prefix along with the URL heartbeat index in a key-value pair format.
a. Example (Single Environment):
{“jarvis_db2”: “db2_test_url_heartbeat-*”}
b. Example (Multiple Environments):
{
“jarvis_db2”: “db2_test1_url_heartbeat-*”,
“jarvis_test”:
}
“db2_test1_url_heartbeat-*”
• System_heartbeat_index – Configure this similar to Url_heartbeat_index, but use the system heartbeat index instead of the URL heartbeat index.
• Jarvis_UI_url – Specify the IANN Monitor UI URL.
• Server_metrics – To monitor server metrics, provide the server metrics index along with its name and prefix.
a. Example (Single Server):
{
“jarvis_db2”: [“SI Server;jarvis_db2_metrics_general-*”] }
b. Example (Multiple Servers):
{
“jarvis_db2”: [“SI Server;jarvis_db2_metrics_general-
*”,
“Another Server;another_metrics_general-*”]
}
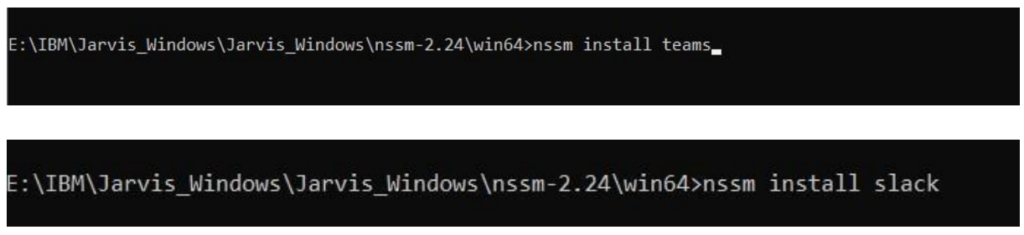
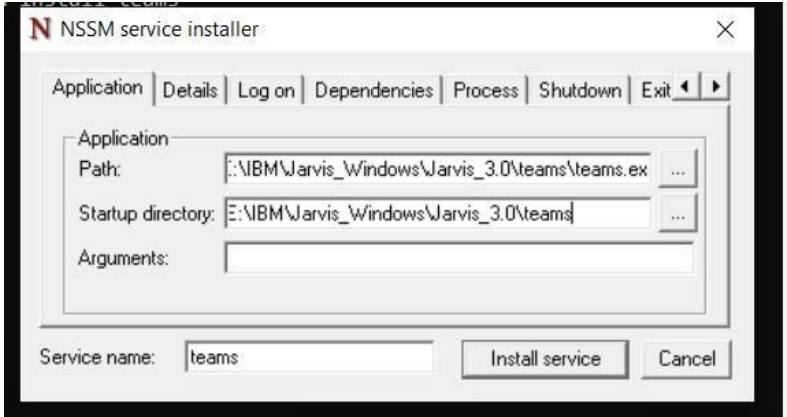
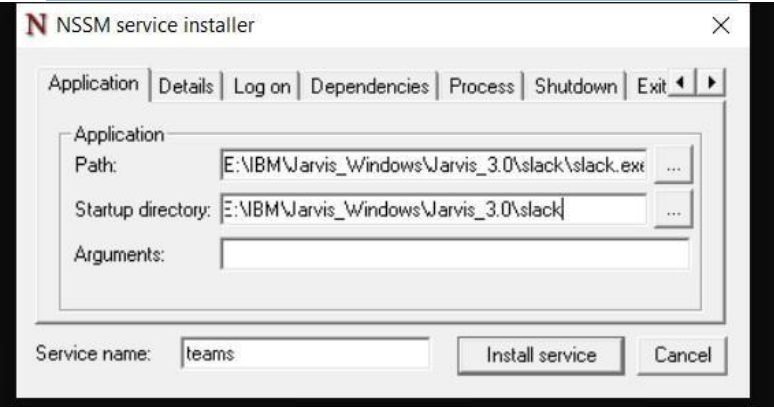
3. To Install Teams and Slack package, go back to the nssm folder and open win64 folder. Now select the path and type cmd, it will take you to the command prompt window as shown below.

then enter the below command for teams: nssm install teams For slack: nssm install slack
4. Click on the 3 dots and select Teams file, which is present inside the server folder and click on OK. Now, Teams Service will be installed successfully.
5. Click on the 3 dots and select Slack file, which is present inside the server folder and click on OK. Now, Slack Service will be installed successfully.
6. To start Teams, Go to services in task manager and search for Teams. Right click on the heartbeat and then start it, it will come to running state as shown below.
7. To start Slack, Go to services in task manager and search for Slack. Right click on the slack and then start it, it will come to running state as shown below
1.7 Encrypt the password:
1. You will be able to see encryptinput file in server/Client folder.
2. Select the path of it and type cmd, it will navigate you to the command prompt window.
3. Type ./encryptinput
4. It will ask for the password, Provide the actual password.
It will generate an encrypted password.
IANN Monitor Client Installation
2.1 Uploading the Packages
We need to download the packages from the S3 bucket, Bitbucket, or any other clientspecific repository.
Step 1:
Access the URL below, it will navigate you to the S3 bucket login page. jarvisinternalbucket – S3 bucket | S3 | Global (amazon.com) You will be navigated to S3 bucket login page
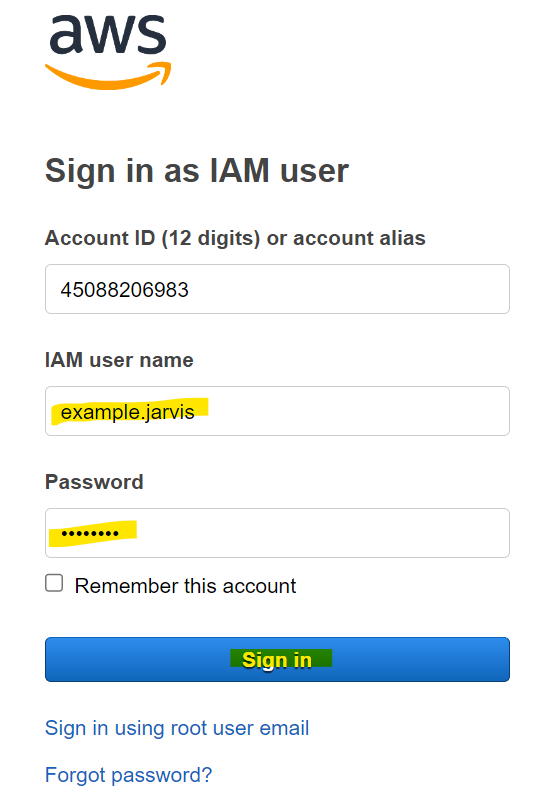
Step 2:
Select IAM user and Provide Account ID as shown below: Account ID: 45088206983(Sample)
Step 3:
Now, provide the username and password as given below:
Username: example.Jarvis
Password: P##@12#
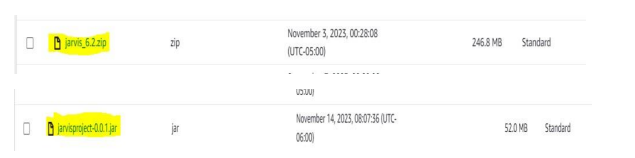
Step 4:
Once after logging in into the S3 bucket, you will be able to see all the packages which need to be updated.
Step 5:
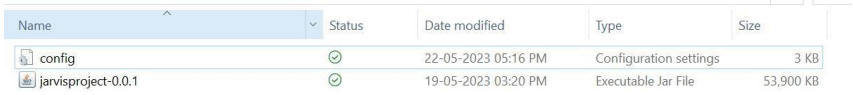
After uploading the above packages. Go to the Jarvis installed path after logging into the specific server. Create a folder for Jarvis API Jar, where we will give the SI DB details to monitor the datapoints that are fetching from Database.
2.2 Updating the YML File for IANN Monitor API
To configure the application.yml file and provide the SI DB details and save the yml file. server: port: 9091 source: SI_DATABASE_Name (Need to provide
Sterling Integrator’s Database Name) application: yml: spring: servlet:
multipart: max-file-size: 1GB max-requestsize: 1GB datasource:
type: com.zaxxer.hikari.HikariDataSource
url: jdbc:oracle:thin:@internal.cfkgpgedasgz.us-east1.rds.amazonaws.com:1521/SIDATABASE_NAME (Need to Provide DB_URL)
username: SI_DB_Username (Need to provide Sterling Integrator’s Database
Username)
password: SI_DB_Password (Need to provide Sterling Integrator’s Database
Password)
driver-class-name: oracle.jdbc.OracleDriver (Need to provide driver class name
with
respective to database type)
Hikari:
connection-timeout:
120000 minimum-idle:
5 maximumpool-size:
15 auto-commit: false
jpa: show_sql: false
open-in-view:
false database-platform: org.hibernate.dialect.Oracle12cDialect
(Need to provide
datasource platform with respect to database type)
properties:
# hibernate:
# dialect:
com.jarvisproject.CustomSqlServerDialect id:
new_generator_mappings: true
2.3 Installation of IANN Monitor API:
Step 1:
Now bring up the Iann monitor jar go to Iann monitor jar folder select path and type cmd open command prompt
Step 2:
Unzip the package jarvis_6.2.zip
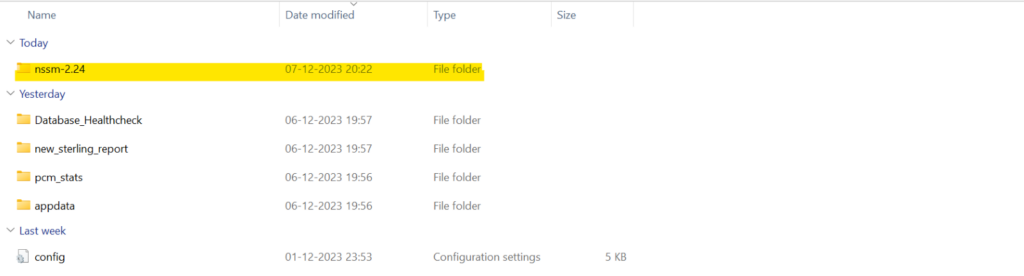
Step 3:
After the unzipping the package jarvis_6.2, you can find nssm-2.24
Step 4:
Go to the folder nssm-2.24 and select win64
Step 5:
select path and enter cmd


Step 6:
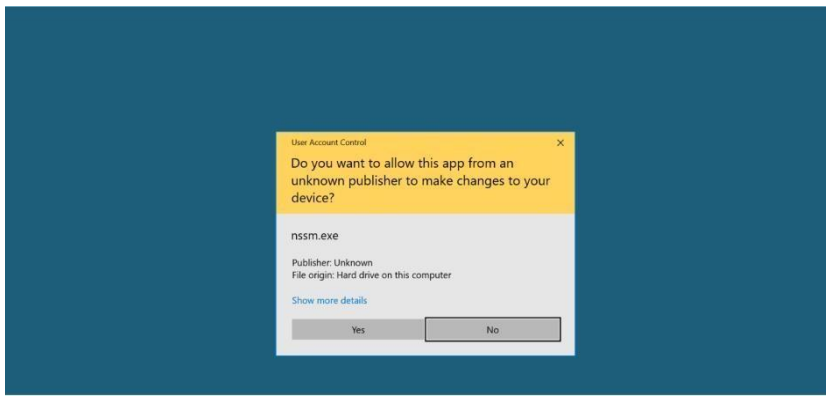
Enter the command nssm install Iann_Monitor_Api

Click on yes
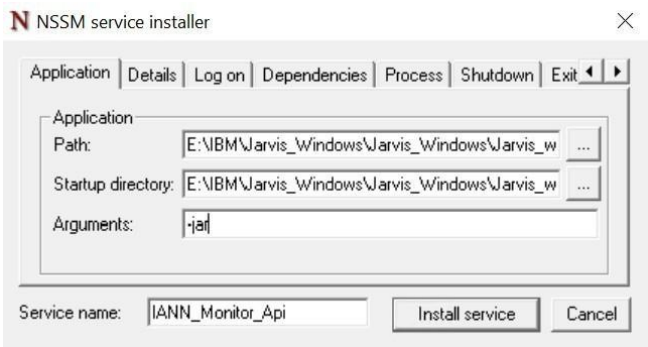
You will get a pop up of nssm for creating a service
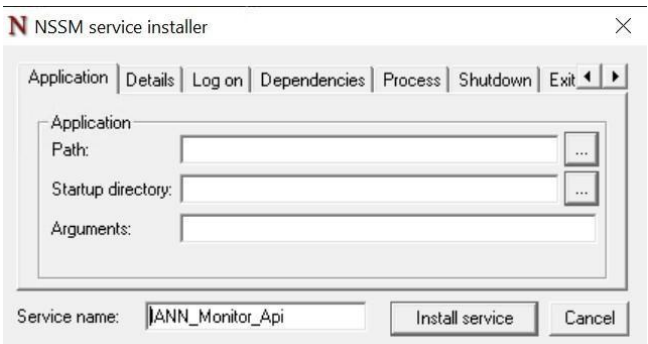
Step 7:
Select Iann monitor api jar location at startup Colum. Select javaw.exe (java/bin) file location in path column and provide -jar in argument location as below and then click on install service.
Step 8:
Open task manager and then go to the services
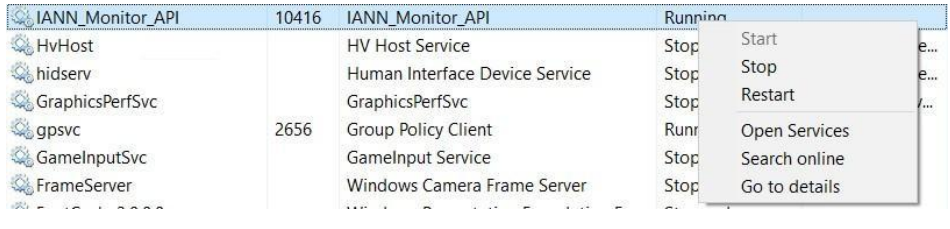
Step 9:
Search for IANN_Monitor_API and check whether it is running or not FYR: Examine the Iann Monitor api jar logs and attempt to access the Api URL to see if the Iann monitor api is functioning properly.
2.4 Updating the config File for IANN monitor Agents
Step 1:
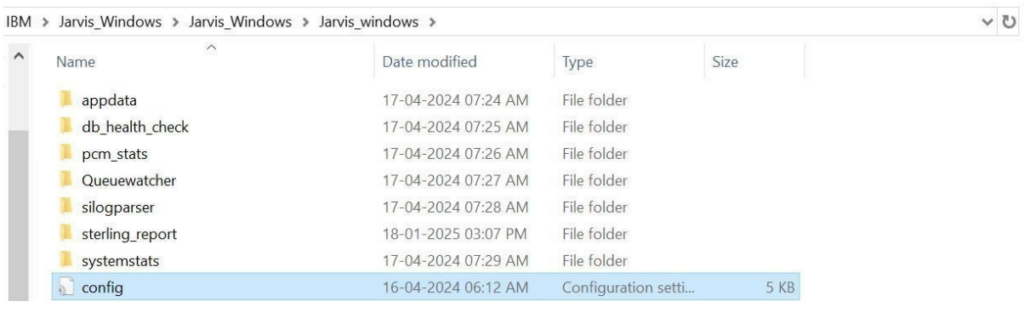
Log in to the SI Node 1 server, create the “Jarvis_windows” folder as shown below, and upload the mentioned agents and the config.ini file
Step 2:
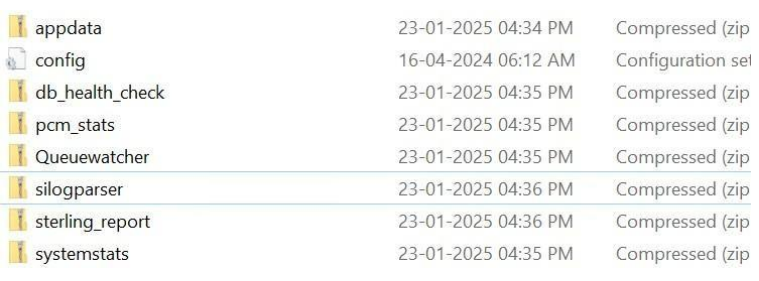
Extract the packages to the required location by clicking on each agent and extracting the zip file as shown below
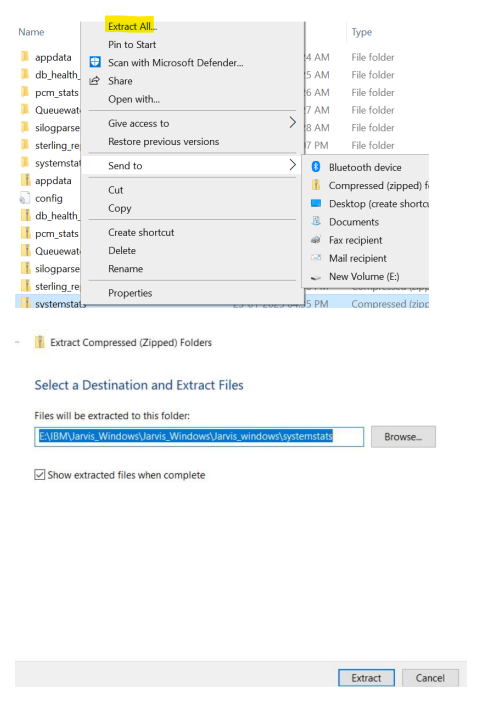
Click on the “Extract” option, and after all the packages are extracted, refer to the screenshot below
Step 3:
Updating config.ini file with the required details:
Step 4:
Right-click the configuration file
Select Open with > Notepad.
[elasticsearch]
index = index_name (Need to provide required index name related to project)
url = https://elasticserachurl:9200/ (Need to provide Elasticsearch URL)
username = elastic
password = eX83i9dP3PpIZgzvipIt1NqFy/lqZlz7hAKUA5Xxp9Y= (Need to provide encrypted password)
use_ssl = True
[appdata]
api_host = http://apiurl:8284 (Need to provide Iann monitor API URL)
db_type = oracle (Need to Provide type of database)
jarvis_username = jarvis
jarvis_password = 8o3DjuRtTlvaqzbehivjk75p77pnUsnTBZSVPdQUVfw=
scheduled_seconds = 300
Waiting_count_version = true
Halted_count_version = true
list=(‘/ceuroot/AL875′ ,’/abc’) days = 3
adapter_list = (‘adapters’) (Need to provide adapters which needs to be monitored)
service_list = (‘services’) (Need to provide schedulers which needs to be monitored)
schedulers_list = (‘schedulers’) (Need to provide schedulers which needs to be monitored)
archive = true
index = true purge = true
#get_mailbox_depth_query = false
get_mailbox_ref_query = true
document_processed = true
db_usage = true
mailbox_long_running = true
run_time_of_service = true
adapter_status = true
adapter_uptime_status = true
halted_count = true
halting_count = true
interrupted_count = true
waiting_count = true
waiting_on_io_count = true
Purge_count = true
app_availability_time = true
schedulers_status = true
Non_index = false
Bp_status = false
get_mailbox_depth = true
external_perimeter = true
active_count = false
get_mailbox_depth_seconds = 120
document_processed_seconds = 120
db_usage_seconds = 120
external_perimeter_seconds = 120
adapter_status_seconds = 120
halted_count_seconds = 120
halting_count_seconds = 120
interrupted_count_seconds = 120
waiting_count_seconds = 120
waiting_on_io_count_seconds = 120
active_count_seconds = 120
archive_seconds = 120
index_seconds = 120
purge_seconds = 120
app_availability_time_seconds = 60
schedulers_status_seconds = 120
run_time_of_service_seconds = 120
adapter_uptime_status_seconds = 120
bp_status_seconds = 60
non_index_seconds = 60
mailbox_long_running_seconds = 60
[db_healthcheck]
bp_locks_minutes = 30
days = 10
over_all_database_size = true
database_check = true
tablespace_usage = true
active_sessions = true
inactive_sessions = true
total_sessions = true
current_blocked_sessions = true
invalid_object_status = true
unusable_indexes = true
database_locks = true
db_response_time = true
lifespan = false top_tables = true
mailboxes_with_unextracted_messages = true
mailboxes_with_unextracted_messages_older_than_ndays = true
mailboxes_with_extracted_messages = false
no_of_messages_extracted_older_n_days = true
mailbox_with_unextracted_messages_older_than_ndays = true
purge_locks = true
cluster_status = false
redolog_group_status_check = true
Amount_of_Redo_Generated_per_Hour = true
redo_generation_per_day = true
redo_file_change = true
cpu_util = true ram_util = true
db_conn = true
write_latency = true
read_latency = true
read_iops = true
write_iops = true
read_throughput = true
write_throughput = true
over_all_database_size_seconds = 1800
database_check_seconds = 900
tablespace_usage_seconds = 1800
active_sessions_seconds = 1800
inactive_sessions_seconds = 1800
total_sessions_seconds = 1800
current_blocked_sessions_seconds = 1800
invalid_object_status_seconds = 1800
unusable_indexes_seconds = 1800
database_locks_seconds = 1800
db_response_time_seconds = 1800
lifespan_seconds = 1800
top_tables_seconds = 1800
mailboxes_with_unextracted_messages_seconds = 1800
mailboxes_with_extracted_messages_seconds = 1800
no_of_messages_extracted_older_n_days_seconds = 1800
mailbox_with_unextracted_messages_older_than_ndays_seconds = 1800
purge_locks_seconds = 300
cluster_status_seconds = 120
redolog_group_status_check_seconds = 1800
Amount_of_Redo_Generated_per_Hour_seconds = 1800
redo_generation_per_day_seconds = 1800
redo_file_change_seconds = 1800
cpu_util_seconds = 1800
ram_util_seconds = 1800
db_conn_seconds = 1800
write_latency_seconds = 1800
read_latency_seconds = 1800
read_iops_seconds = 1800
write_iops_seconds = 1800
read_throughput_seconds = 1800
write_throughput_seconds = 1800
[sterling_reports]
trusted_certs = true
ca_certs= true
system_certs = true
long_running_bp_steps = true
long_running_bp = true
bp_definition_details_for_si = true
bp_runs_bp_steps = true
no_execution_per_node = true
bp_records_per_month = true
bp_with_large_bp_steps = true
trusted_certs_seconds = 1800
ca_certs_seconds = 1800
system_certs_seconds = 1800
long_running_bp_steps_seconds = 1800
long_running_bp_seconds = 1800
bp_definition_details_for_si_seconds = 1800
bp_runs_bp_steps_seconds = 1800
no_execution_per_node_seconds = 1800
bp_records_per_month_seconds = 1800
bp_with_large_bp_steps_seconds = 1800
long_bp_steps_time_seconds = 1800
long_bp_time_seconds = 60
large_bp_steps = 3000
[pcm_stats]
application_ref_query = true
tp_ref_query = true
wf_ref_query = true
application_ref_query_seconds = 60
tp_ref_query_seconds = 120
wf_ref_query_seconds = 180
After editing the config.ini file with the required details, save the file.
2.5. Installation of Jarvis Agents:
Step 1:
To start the Jarvis Beats:
Go to the folder nssm-2.24 and select win64 as shown below
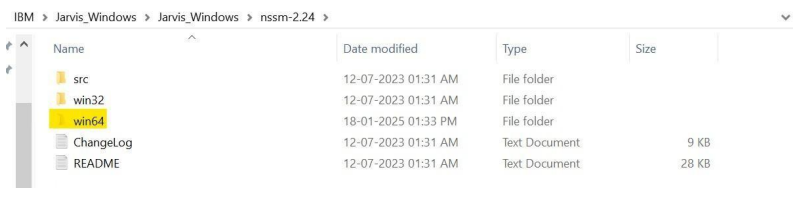
Step 2:
And select path and enter cmd

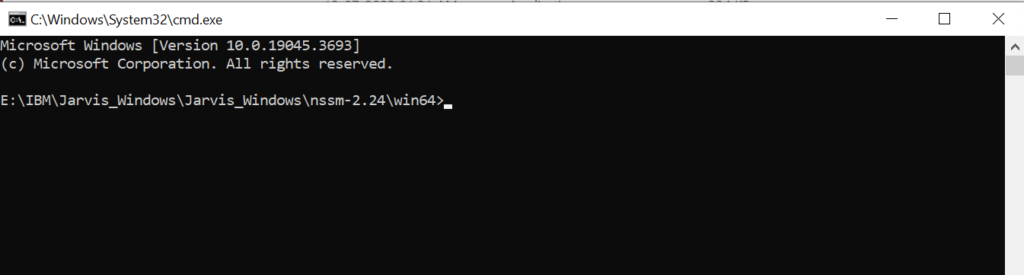
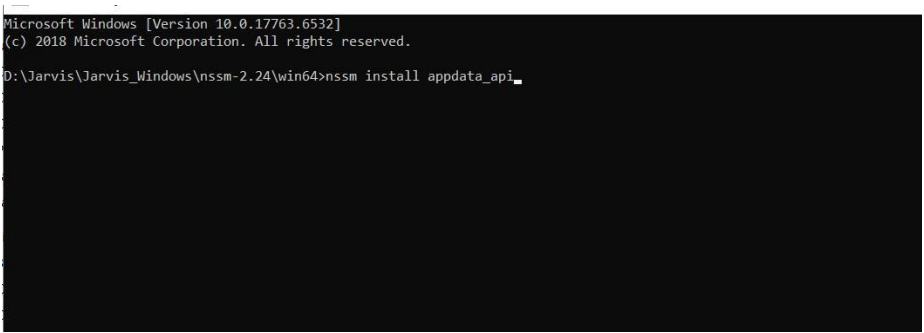
Step 3:
Enter the command nssm install appdata
Click on yes

You will get a pop of nssm for creating a service

Go to Jarvis folder, select the appdata package location till /appadata.exe in path Select path till in startup directory
Step 4: Select the Application path by clicking on three dots at the right and select the required path
Step 5: After providing all the required paths click on the “Install service”
Step 6: Open task manager, go to services start the appdata beat
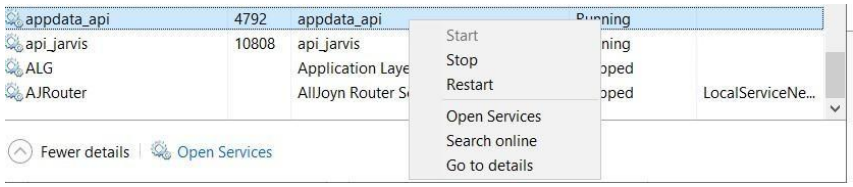
Step 7:
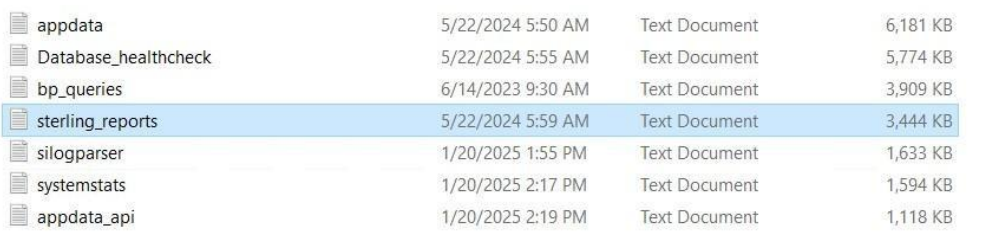
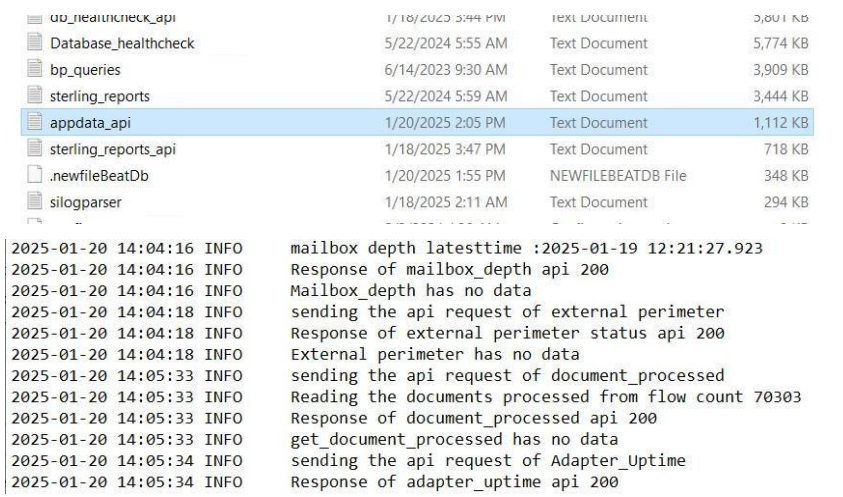
Go to the appdata package location and open the “appdata_api.log” text document and verify the logs for any errors or exceptions and then validate the time of the logs with the current time.
2.5.1 DB HealthCheck agent
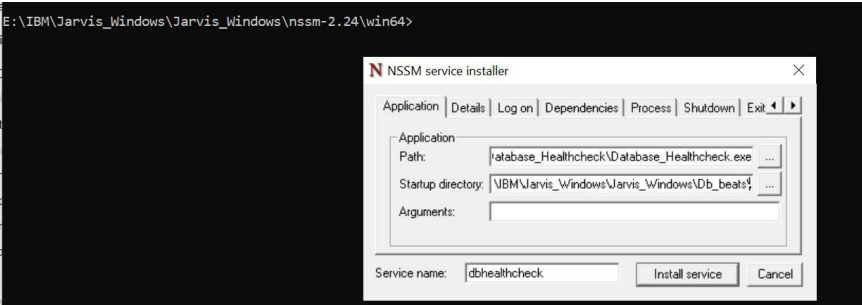
1. To Install Dbhealthcheck, go back to the nssm folder and open win64 folder. Now select the path and type cmd, it will take you to the command prompt window as shown below.
2. Click on the 3 dots and select dbhealthcheck file, which is present inside the Jarvis_windows folder and click on install button. Now, dbhealthcheck Service will be installed successfully.
3. To start dbhealthcheck, Go to services in task manager and search for dbhealthcheck. Right click on the dbhealthcheck and then start it, it will come to running state as shown below
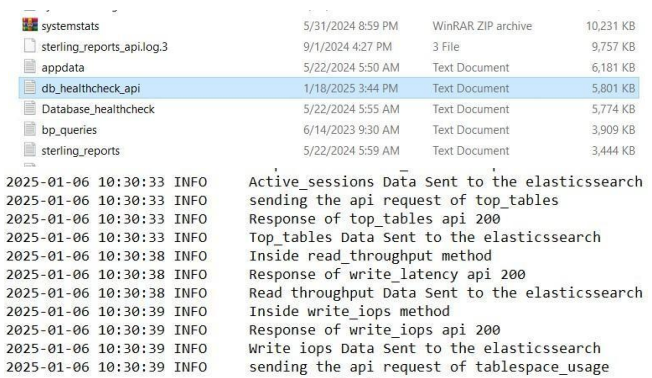
4. Go to the dbhealthcheck package location and open the “db_healthcheck_api.log” text document and verify the logs for any errors or exceptions and then validate the time of the logs with the current time.
2.5.2 pcm_stats agent
1. To Install pcmstats, go back to the nssm folder and open win64 folder. Now select the path and type cmd, it will take you to the command prompt window as shown below.
2. Click on the 3 dots and select pcmstats file, which is present inside the Jarvis_windows folder and click on install button. Now, pcmstats Service will be installed successfully
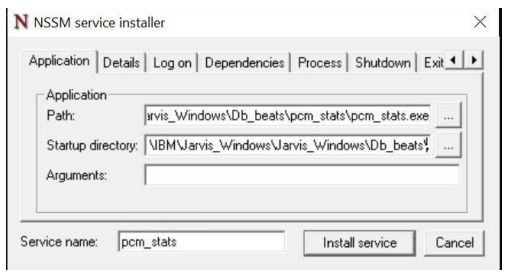
3. To start pcmstats, Go to services in task manager and search for pcmstats. Right click on the pcmstats and then start it, it will come to running state as shown below
4. Go to the pcmstats package location and open the “pcm_stats.log” text document and verify the logs for any errors or exceptions and then validate the time of the logs with the current time.
2.5.3 Silogparser agent
1. To Install silogparser, go back to the nssm folder and open win64 folder. Now select the path and type cmd, it will take you to the command prompt window as shown below.
2. Click on the 3 dots and select silogparser file, which is present inside the Jarvis_windows folder and click on install button. Now, silogparser Service will be installed successfully.
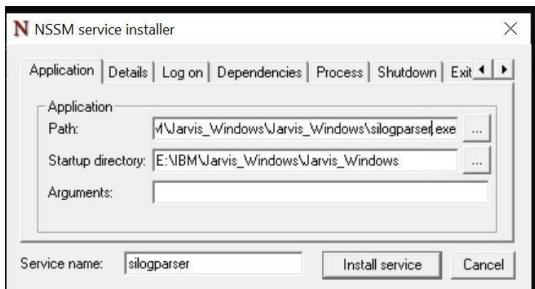
3. To start silogparser, Go to services in task manager and search for silogparser. Right click on the silogparser and then start it, it will come to running state as shown below.
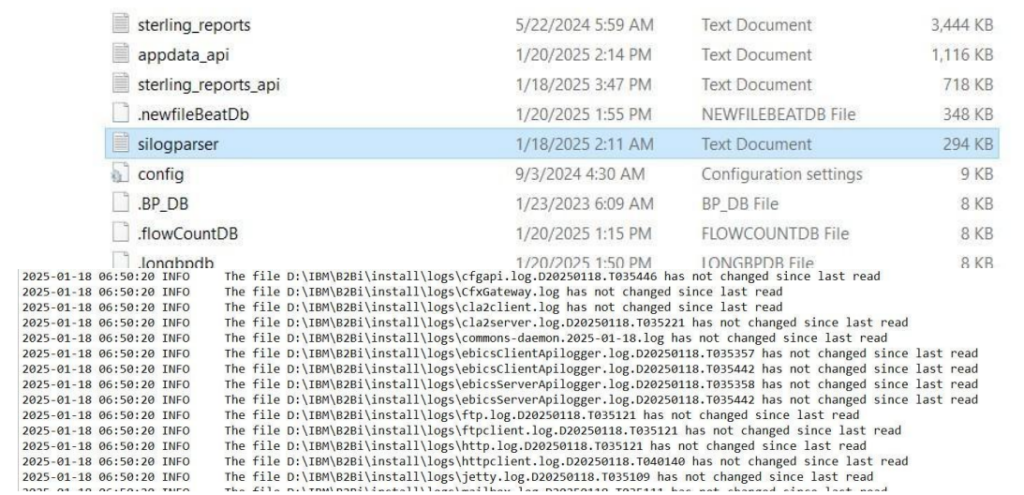
4. Go to the silogparser package location and open the ” silogparser.log ” text document and verify the logs for any errors or exceptions and then validate the time of the logs with the current time.
2.5.4 Systemstats agent
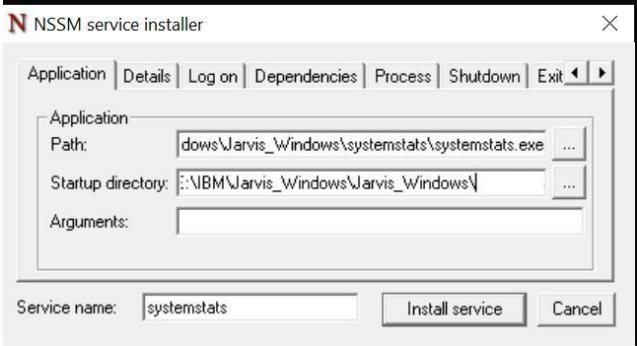
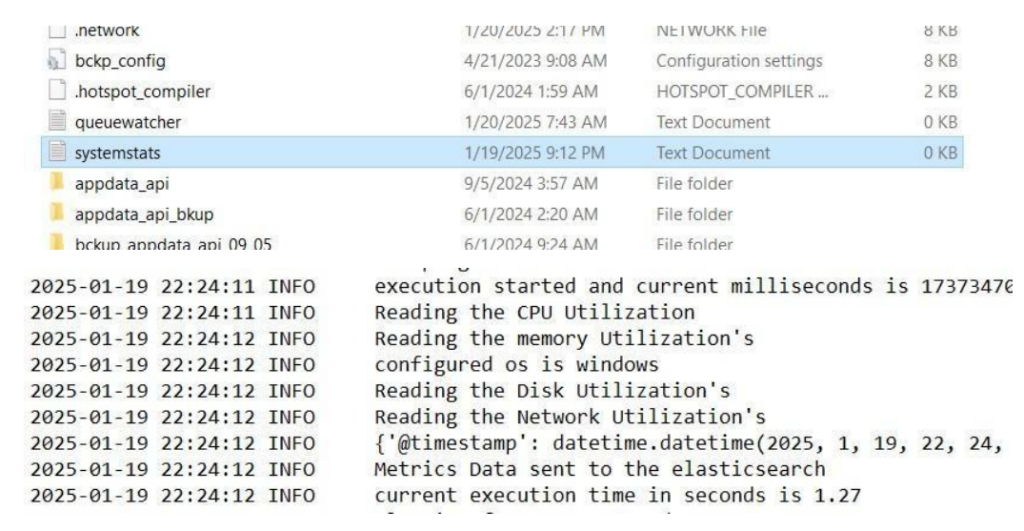
1. To Install systemstats, go back to the nssm folder and open win64 folder. Now select the path and type cmd, it will take you to the command prompt window as shown below.
2. Click on the 3 dots and select systemstats file, which is present inside the Jarvis_windows folder and click on install button. Now, systemstats Service will be installed successfully.
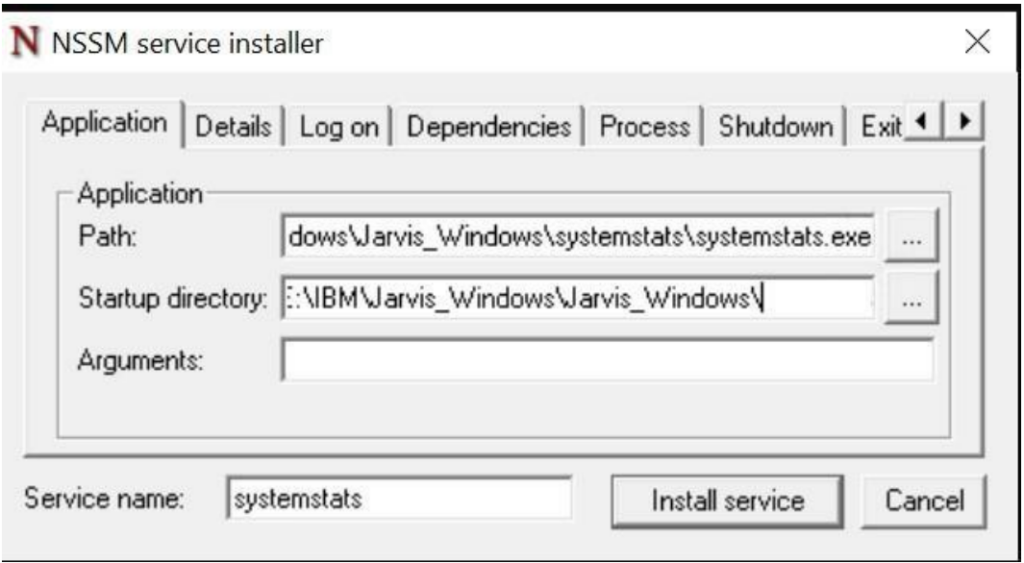
3. To start systemstats, Go to services in task manager and search for systemstats. Right click on the systemstats and then start it, it will come to running state as shown below.
4. Go to the systemstats package location and open the ” systemstats.log” text document and verify the logs for any errors or exceptions and then validate the time of the logs with the current time.
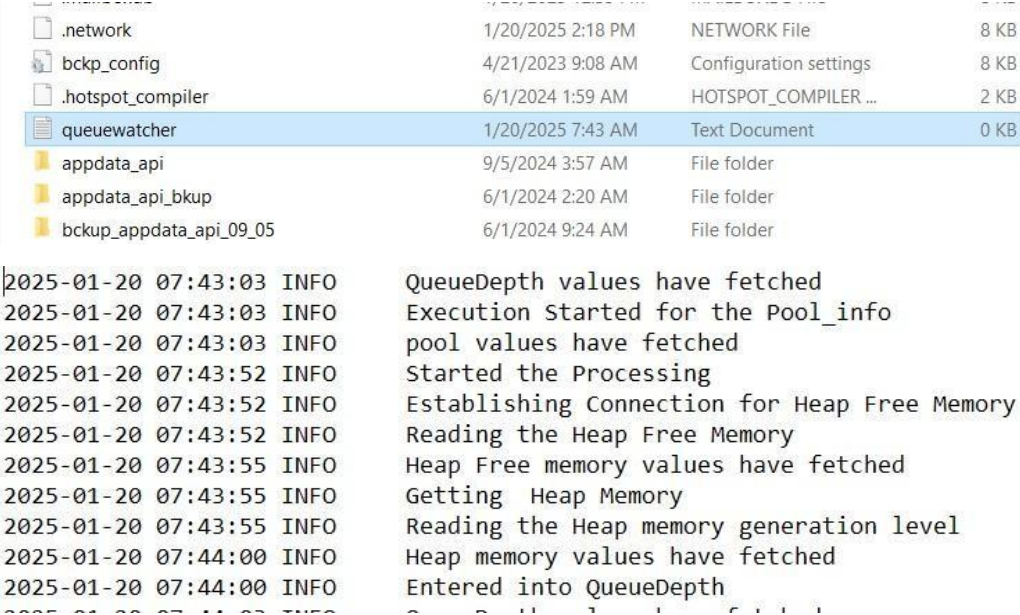
2.5.5 Queuewatcher agent
1. To Install queuewatcher, go back to the nssm folder and open win64 folder. Now select the path and type cmd, it will take you to the command prompt window as shown below.
2. Click on the 3 dots and select queuuewatcher file, which is present inside the Jarvis_windows folder and click on install button. Now, queuewatcher Service will be installed successfully.
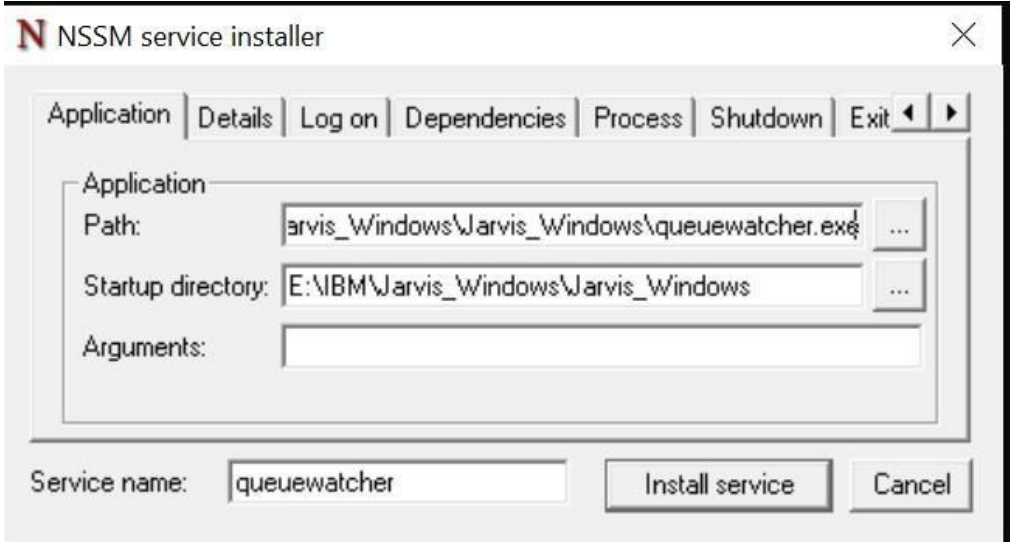
3. To start queuewatcher, Go to services in task manager and search for queuewatcher. Right click on the queuewatcher and then start it, it will come to running state as shown below
4. Go to the queuewatcher package location and open the ” queuewatcher.log ” text document and verify the logs for any errors or exceptions and then validate the time of the logs with the current time.
2.5.6 Sterling reports agent
1. To Install sterling reports, go back to the nssm folder and open win64 folder. Now select the path and type cmd, it will take you to the command prompt window as shown below.
2. Click on the 3 dots and select sterling reports file, which is present inside the Jarvis_windows folder and click on install button. Now, sterling reports Service will be installed successfully.
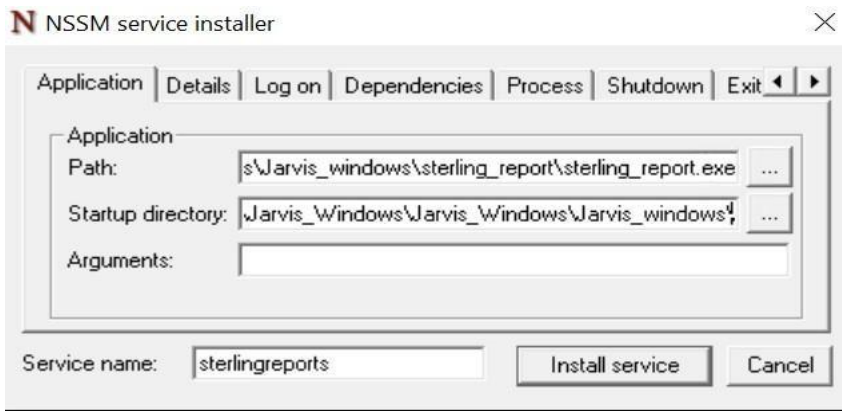
3. To start sterlingreports, Go to services in task manager and search for sterlingreports. Right click on the sterlingreports and then start it, it will come to running state as shown below.

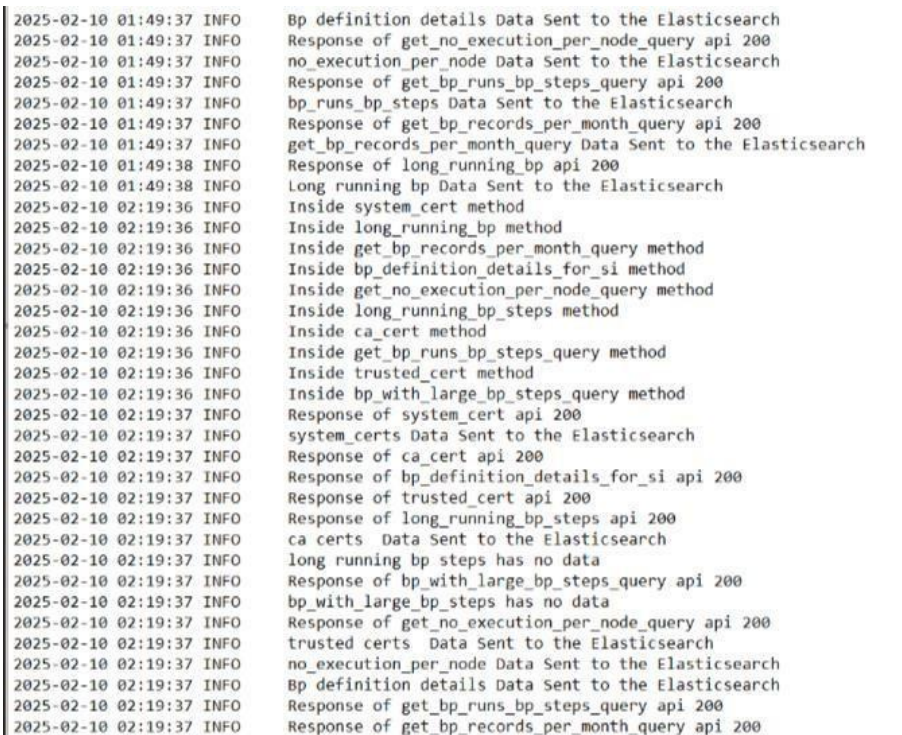
4. Go to the sterlingreports package location and open the ” sterling_reports.log” text document and verify the logs for any errors or exceptions and then validate the time of the logs with the current time.