IANN Monitor Installation Procedure – 6.3.3
1. Introduction:
IANN Monitor Monitoring tool (JM) offers an integrated monitoring and alerting capability for IBM Sterling B2B platforms. JM monitors and alerts the users on the following parameters,
• System Health
• IBM B2B and MFT application
• Application logs
IANN Monitor is a lightweight component that is deployed on the IBM Sterling Integrator/IBM Sterling File Gateway / IBM perimeter servers to send critical system and application health information to JM. JM platform is available on cloud and On-premises. It improves the efficiency of the IBM/B2B / MFT Platform by
• Reducing the cost of Health checks by 95% when done daily.
• Reduces the downtime of your B2B/MFT Platform
• Improve the quality of services for your file transfers and B2B
• Provides centralized monitoring of various data points required to manage the platform.
• Single tool to track the End-to-End Monitoring system.
IANN MONITOR PRE-REQUISITES
Hardware requirements refer to the specific physical components needed to run IANN Monitor software or systems efficiently, such as processors, memory, and storage. Ensuring adequate hardware specifications helps achieve optimal performance and reliability for applications and services.
IANN MONITOR Server Specs: 4 Core Processor, 16GB RAM, Application- 300GB.
| Software/Certificate | Versions | Required |
|---|---|---|
| Java | 17 | Yes |
| Elastic Search | v8.12.2 | Yes |
| Kibana | v8.12.2 | Yes |
| .crt | NA | Yes |
| .key | NA | Yes |
| .ca-bundle | NA | Yes |
| Keystore.p12 | NA | Yes |
| Trustore.p12 | NA | Yes |
| DNS (for the IANN Monitor Server) | NA | Yes |
| Pre-Requisites | Description |
|---|---|
| Database Permissions | Administrative & read access |
| Sterling Integrator’s Database Details | Database URL, name, type, Port, Schema, Username & Password |
| Applications User Credentials | Sterling Integrator dashboard & Queuewatcher page |
| Logo | Norfolk logo for IANN Monitor UI in png format |
| Server IPs/Host name & URLs | IP addresses, URLs, and host names for Sterling Integrator Servers (IPs and URLs should be reachable via Ping and CURL from the IANN Monitor Server) |
| OS Version | Need OS Version of provided servers |
| Ports | 3000, 9200, 5601 ensure these ports should be open for the IANN Monitor Server & 9090 should be allowed in IANN Monitor Server and Source |
| Adapters & Schedulers | Adapters and Schedulers which need to track in IANN Monitor UI |
| Certificates | Certificates (CA, Trusted & System Certificates) need to track in IANN Monitor UI from Sterling Integrator |
| Logs paths | Logs path of Sterling Integrator |
1.1 IANN Monitor Server Packages & Pre-Requisites:
IANN Monitor Server Packages:
Heartbeat agent, System Stats agent, Elastic search, Kibana, IANN Monitor UI, Default dashboard, Alerts, Send mail and Teams
1.1.1 Heartbeat Agent:
The Heartbeat Agent is designed to monitor the status of SI (Sterling Integrator) and other application Note:
Please provide the IP addresses, URLs, and host names for all the servers. Ensure that all listed server IPs and URLs are reachable via Ping and CURL from the IANN Monitor Server.
1.1.2 System stats Agent:
The System stats Agent is used to monitor key resource utilizations on the server, including (CPU, RAM, DISK and NETWORK IN/OUT)
Note: Need to provide the OS name.
1.2 Elasticsearch:
Elasticsearch is a database designed for efficient data storage and retrieval, offering fast search capabilities that deliver results quickly. It excels in storing and accessing data rapidly. Its distributed architecture ensures scalability and high performance for handling large volumes of data.
Note:
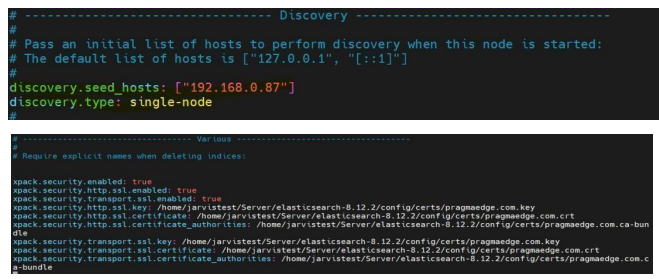
To configure Elasticsearch, specify the port (default is 9200) and ensure it’s open for the IANN Monitor Server. Provide the necessary certificates (.crt, .key, and .ca-bundle). In the elasticsearch.yml file, include settings for discovery.seed_hosts, discovery.type (singlenode or multi-node), cluster.name, hostname, and the paths to the certificates.
1.3 Kibana:
Kibana is a data visualization tool that integrates with Elasticsearch, enabling users to create interactive with indexes and visualizations. It offers powerful querying and filtering capabilities to help analyze and interpret complex datasets.
Note:
To configure Kibana, specify the port (default is 5601) and ensure it’s open for the IANN Monitor Server. Provide the necessary certificates (.crt, .key, and .ca-bundle). In the kibana.yml file, include the Elasticsearch URL, generated username and password, server host, and paths to the certificates.
1.4 Encrypt Input:
Encryption protects sensitive passwords used for authenticating agents, ensuring secure transmission of data to Elasticsearch.
1.5 IANN Monitor UI:
IANN Monitor enables users to set up notifications based on specific data thresholds, helping to proactively identify and address potential issues with visualization capabilities, users can create customizable dashboards to monitor and analyze metrics in real-time. This integration ensures timely alerts and insightful data visualization for effective decision making and system management. IANN Monitor UI consists of the below mentioned Packages to be configured to run the IANN Monitor smoothly.
1.5.1 Application Yml:
The `application.yml` file contains the configuration details needed to connect to Elasticsearch. Additionally, provide the Elasticsearch details and include the username and password used to log in to the IANN Monitor UI.
Note:
Specify port 3000 and ensure it’s open for the IANN Monitor Server
1.5.2 Default Dashboard:
The Default Dashboard is a bundled package that facilitates the creation of dashboards, visualizations, and alerts with predefined configurations, all accessible with a single click
1.5.3 IANN Monitor UI Jar:
The JAR file is essential for running the application, containing all the necessary components and dependencies. It facilitates the execution of the application by providing the packaged code and resources. This JAR file manages the Jarvi URL needed for its operation.
1.5.4 Keystore.p12:
This file is used to store a private key along with its associated certificate chain in a single, encrypted container.
1.5.5 Privatekey.cer:
This file contains the private key certificate, which is crucial for secure authentication and encryption.
1.5.6 Trustore.p12:
This file is used to store trusted certificates, enabling the application to verify and establish secure connections with other systems.
1.5.7 Logo:
Please ensure the logo is provided in PNG format.
1.5.8 Alerts:
Alert agent is used to identify abnormalities based on configured thresholds and detect potential issues. This script needs to run continuously to raise the alert.
1.5.9 Send Mail:
The Send Mail Agent notifies users of events in IANN Monitor through email, Slack, and Teams.
1.5.10 Teams:
The Teams Agent notifies users of events in IANN Monitor through Slack, and Teams
1.6 IANN Monitor API Jar:
Api jar collects the data from the sterling integrator database, and it sends the data to agents when the request is triggered.
1.6.1 Application.yml:
Need to provide the Port (9090 should be allowed in IANN Monitor Server) and Source. Need to provide database URL, name, username and password.
1.7 Appdata Agent:
Appdata agent that tracks data points for the Sterling B2B application. Monitor and manage application data efficiently. Below are the data points included in the agent. Archive, Index, Purge, Mailbox depth, Document processed, Db Usage, Long Running Mailboxes, Service Run time, Adapter status, Adapter Uptime Status, halted count, halting
count, Interrupted count, waiting count, waiting on IO Count, BP Status, Scheduler Status, Application availability time, non-index, External Perimeter and Active count, Adapter list, Schedulers list.
Notes: Need to add the list of adapters and schedulers which need to track in IANN Monitor.
Note:
API Host (9090 port should be accessible from IANN Monitor server to IANN Monitor client and vice versa) Database Type (DB2)
Username & Password (By default with IANN Monitor swagger application will get the credentials)
1.8 Database Health Check:
Database Health Check Monitors the Database metrics to monitor the health of the database. Below are the datapoints which are tracking in Database Health.
Database Size, Database Check, Tablespace Usage, Active Sessions, Inactive Sessions, Total Sessions, Database Locks, DB Response Time, Lifespan, Top Tables, Purge Locks, Cluster Status, DB CPU, DB RAM, DB Connections, Read Latency, Write Latency, Read IOPS, Write IOPS, Read Throughput, Write Throughput, Mailboxes with Unextracted Messages, Mailbox with Extracted Messages, No 0f Messages extracted older than n days, Redolog Group Status Check, Redo Generated Per hour, Redo Generated Per day, Redo File Change
1.9 Queuewatcher:
Queuewatcher Tracks the Datapoints like Queue depth, Heap Memory, None Heap Memory, Free Heap Memory and Pools, Active threads.
Note:
Need to provide Queue Watcher URL Username and password (Need to provide the credentials of queuewatcher URL to get data to IANN Monitor)
1.10 Sterling Reports:
Sterling Reports which track BP Related Data Points as mentioned below. Certificates, Long Running BP Steps, Long Running BP, BP Definition Details for SI, BP Runs BP Steps, No Execution Per Node, BP Records Per Month and BP with Large BP Steps.
Note:
Certificates (Need to provide the list of CA, Trusted & System certificates to be monitored)
1.11 SI Log Parser:
This agent will track the Authentication logs and other logs in Sterling Integrator.
Note:
Need to provide logs path of Sterling integrator
1.12 Process Monitor:
This agent will track the status of processes.
Note:
Need to provide Process name.
2. Server deployment
• Download the Server.zip from bitbucket or repository provided. • unzip the Server.zip using below command unzip Server.zip
2.1 Configure the Elasticsearch
Steps to Configure Elasticsearch:
1. Navigate to the Server folder:
- Use the following command:
cd Server
2. Extract the Elasticsearch archive:
- Use the following command:
tar -xvzf elasticsearch8.12.2.tar.gz
3. Go to the extracted Elasticsearch folder:
- Use the following command:
cd elasticsearch-8.12.2
4. Edit the elasticsearch.yml file:
- Open the file using:
vi elasticsearch.yml
5. Update the certificates in the certs folder inside Elasticsearch:
- Ensure the following formats are updated:
- crt – Certificate
- ca-bundle – Certificate authority bundle
- key – Private key
This will ensure that the connections to Elasticsearch are secure.
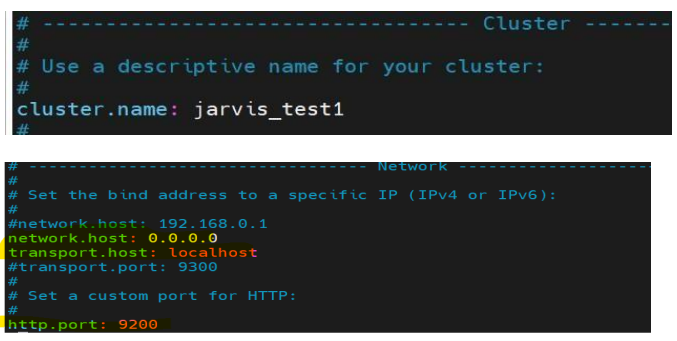
6. Update the elasticsearch.yml file with the following parameters:
- cluster name
- discovery.seed.host
- discovery.type
- certificate path
Note: These details will be obtained from Step 2.
7. Save the file and start Elasticsearch:
- Save the file using:
Press Esc → Type:wq!→ Press Enter - Run Elasticsearch with the following command:
nohup ./bin/elasticsearch > /dev/null 2>&1 &
8. Verify the status of Elasticsearch:
- Use the following command:
telnet [your public/private IP] 9200
(Example: telnet ec2-52-55-71-171.compute-1.amazonaws.com 9200)
9. Password Reset:
- Comment out the following lines in the elasticsearch.yml file:
(SSL certificates block password reset, so the SSL configuration details need to be commented out)
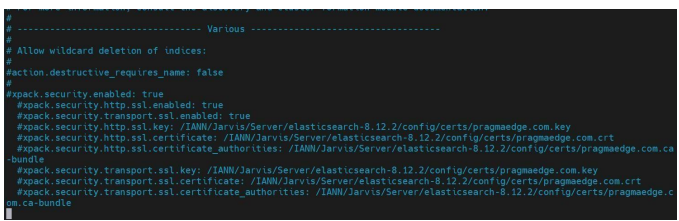
After Commenting, Save the file and restart Elastic Search
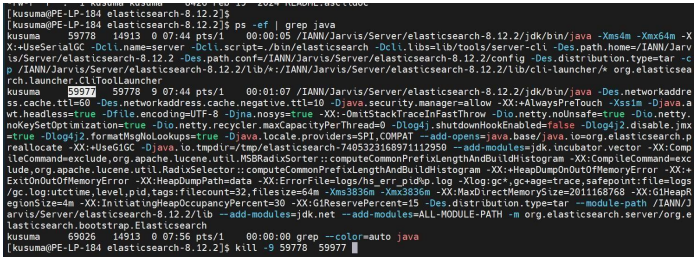
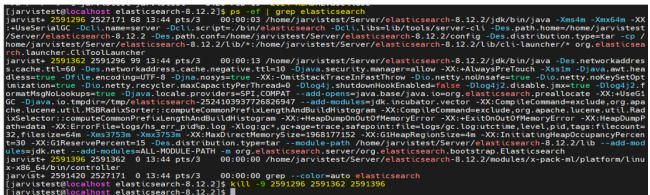
First, we need to get the Process ID of elastic search, and we need to kill the process using the command:
kill –9 <Process-ID>
Following that, we can run the following command in the elastic search path to start the application.
nohup ./bin/elasticsearch > /dev/null 2>&1 &
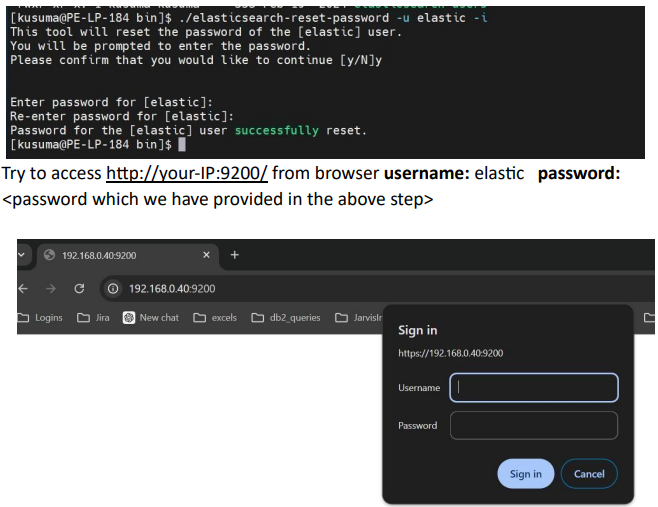
In the elastic search bin path execute the following command: To reset the password
./elasticsearch-reset-password -u elastic –i
Type ‘y’ after the command and Provide password for elastic user in the terminal as shown below
- Edit the elasticsearch.yml file from elasticsearch location using command. vi /config/elasticsearch.yml
- Uncomment the SSL related Lines from elasticsearch.yml and start the elasticsearch using command: nohup ./bin/elasticsearch > /dev/null 2>&1 &
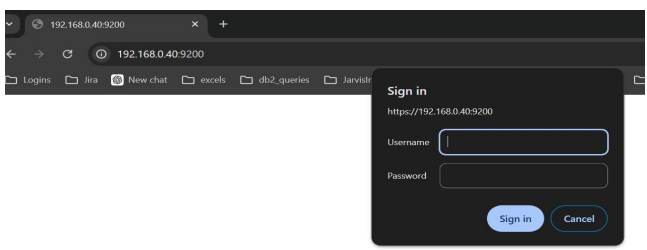
- Finally, try to access https://your-IP:9200/ from browser (e.g., https://ec2-52-55-71-171.compute-1.amazonaws.com:9200/)
- Username: elastic
- Password:
2.2 Configure the Kibana
- Go back to Server folder
- Extract the kibana.tar.gz using the below command:
tar -xvzf kibana-8.12.2-linux-x86_64.tar.gz - Go to kibana-8.12.2-linux-x86_64 folder using the below command:
cd kibana-8.12.2-linux-x86_64 - Stop Elasticsearch by using the command below, then create a user within Elasticsearch as Kibana won’t accept the default elastic user:
kill -9
• Execute the below command from elasticsearch location:
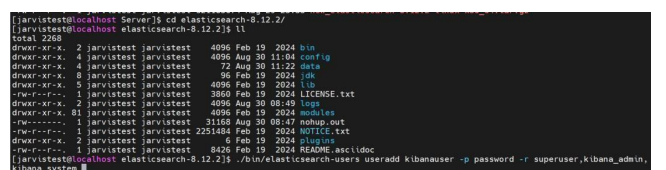
Create a user within Elasticsearch using the command:
./bin/elasticsearch-users useradd kibanauser -p password -r superuser,kibana_admin,kibana_systemOnce after user creation, start Elasticsearch using the below command:
nohup ./bin/elasticsearch > /dev/null 2>&1 &Update the certificates in the certs folder inside the Kibana folder:
- crt (certificate)
- ca-bundle (certificate authority bundle)
- key (private key)
This will ensure that the connections to Kibana are secure.
Go to config folder using the below command:
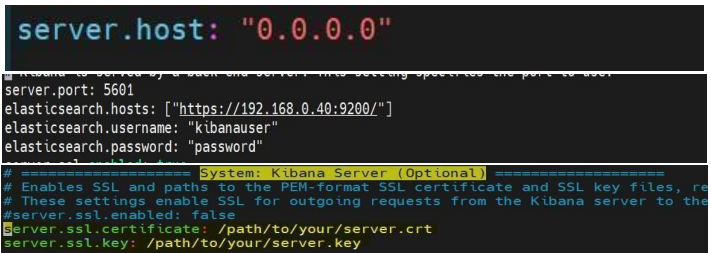
cd config/Open kibana.yml using the vi editor and update the certs path, Elasticsearch URL, and provide the Kibana username and password details (created in the above step) in elasticsearch.hosts, elasticsearch.username, elasticsearch.password, and server.host as shown below:
vi kibana.yml
Save the file using esc:wq!
• start kibana using below command from kibana-7.10.2-linux-x86_64 Directory nohup ./bin/kibana /dev/null 2>&1 &
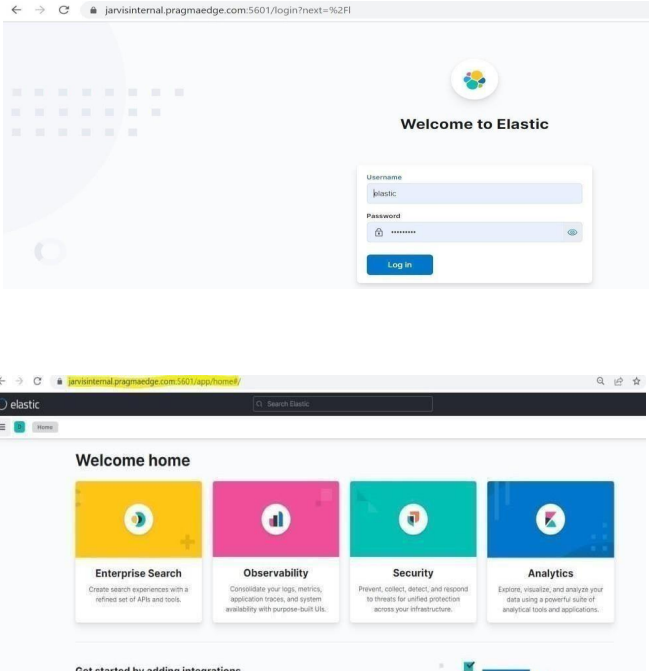
Step 9: Verify it is running using below command telnet localhost 5601 (or) telnet [your public/private ip] 5601 (eg: telnet ec2-52-55-71 171.compute1.amazonaws.com 5601) Try to access https://your-IP:5601/ from browser (eg: https://ec2-52-55-71- 171.compute1.amazonaws.com:5601/)
username : elastic
password:<password>
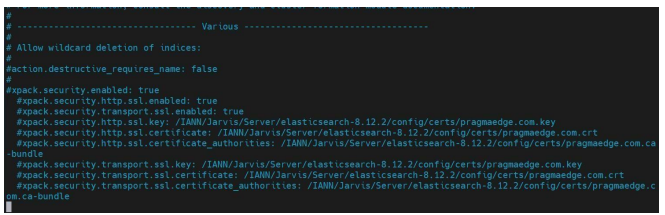
Note: if client provides certs with DNS. We need to use them in the above-mentioned lines (in place of pragmaedge.com.crt, pragmaedge.com.key and pragmaedge.coma.cabundle). If we don’t have any certs provided by the client we can skip adding these lines to yml file.
Please add the below lines in kibana.yml file. server.ssl.enabled: true
server.ssl.certificate: /home/IANN Monitor/IANN MonitorPackage/Server/kibana8.12.2/config/certs/pragmaedge.com.crt #xpack.
security. Enabled: true elasticsearch.ssl.certificateAuthorities: /home/IANN Monitor/IANN
MonitorPackage/Server/kibana- 8.12.2/config/certs/pragmaedge.com.ca-bundle
elasticsearch.ssl.verificationMode: certificate server.ssl.key: /home/IANN Monitor/IANN MonitorPackage/Server/kibana8.12.2/config/certs/pragmaedge.com.key
2.3. IANN Monitor Configurations
2.3.1. Server
Port: The default port for our application is 8080, and you can specify a customized port number on which you would like to run your application
Navigate to the IANN Monitor directory first.
Need to check all the Required files are present in the Directory which is mentioned in the
below list.
• application.yml
• default_dashboard.zip
• IANN Monitor.jar
• Keystore.p12
• privatekey.cer
• Truststore.p12
• Logo.png
Below are the configuration changes which need to be done in application.yml File before installing the application.
Converting certs :
This command is used to generate Truststore using .crt (certificate) keytool -import -file .crt -keystore truststore.p12 -storepass password -noprompt – storetype
pkcs12
This command is used to generate Keystore using .crt (certificate),.key(privatekey)
openssl pkcs12 -export -out keystore-new.p12 -inkey ca.key -in ca.crt -passout pass:password
name
Note: We need to use the certs which are provided inside the elasticsearch certs folder while installing elasticsearch.
2.3.2. Python
Python fileLocation : As part of the setup process, users are required to unzip the provided default dashboard zip file, place its contents into a designated folder, and then provide the path to that file as part of the configuration.
(ex:\python\default dashboard\default_dashboard.exe).
2.3.3. TimeZone
TimeZone format: Here, you will provide the zone format for the data present in your Elasticsearch. Generally, for IANN Monitor we use UTC timezone
2.3.4. Elastic search
In the data configuration provide your Elasticsearch username, password, port, hostname and trust store file path details.
2.3.5. Saml
SAML makes Single Sign-On (SSO) technology possible by providing a way to authenticate a user once and then communicate that authentication to multiple applications.
If you want to be a SAML user, you can enable it with the profile name as saml.
Configuration Details:
Metadata:
Here we provided the local Okta metadata file with the
.xml.tldextension.
Default Role:
By default, the provided role is SUPER_ADMIN.
You can change the default role here.
Default Environment:
By default, the provided environment is DEV.
You can change the default environment here.
Role Options for SAML Users:
You can also change roles for SAML users to:
app_super_adminapp_adminapp_business_adminapp_business_user
Session Timeout Behavior:
After the session timeout, the system will require re-login. Upon re-authentication, the environment will switch to the starting environment provided by the API response, not the environment in which the session timed out.
2.3.6. JWT
• Session-expire: You are required to provide a customized time in milliseconds for the duration of your SAML profile application login.
• Expiration: You are required to provide a customized time in milliseconds for the duration of your application login.
Note:
Expiration is for the IANN MONITOR profile.
Session-expire is for the SAML profile.
Command to Start Your Application with IANN Monitor User:
java -Dspring.profiles.active=saml -jar “YOUR_JAR_NAME”.jar –spring.config=application.yml
java -Dspring.profiles.active=IANN_Monitor -jar “YOUR_JAR_NAME”.jar –spring.config=application.yml
2.3.7. Default User
Here, you need to provide user details to create a default user in this application.
• UserId
• FirstName
• LastName
• PhNo
• EmailId
• Status
• Password
• Role
• Saml
• RefreshToken
2.3.8. Deployment
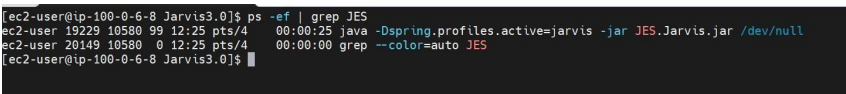
Once application.yml changes are done. Then verify the Jar is Running with the following command. Command: ps –ef | grep
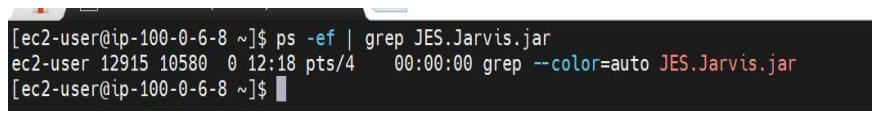
If the process is not running run the package with the below command. Command for normal profile: nohup /java – Dspring.profiles.active=IANN Monitor -jar JES.IANN Monitor.jar /dev/null 2>&1 & Command for SAML profile: nohup /java – Dspring.profiles.active=saml -jar JES.IANN Monitor.jar /dev/null 2>&1 & Note: Required Java package will be available in server.zip Need to update the command based on the Jar name. After successful running of the application, you will find the process running as shown in the below.
Once the application is up and running try accessing the URL of UI https://<IP/DNS>:
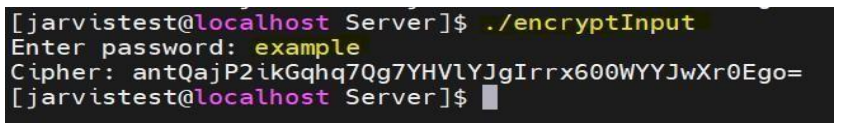
2.4 Encrypt the password
- Give executable permissions to encrypt Input.
- Run the encrypt input file. It will ask for the input string. Once you provide the string to be encrypted, it will provide the encrypted output.
2.5 Configure the heartbeat and systemstats
- Step 1: Go back to Server folder
- Step 2: Open config.ini (vi config.ini) and update elastic details under Elasticsearch section and configure IP to monitor and URL to monitor in heartbeat section as below.
- (Below Highlighted values need to update)
[elasticsearch] index = iaan_monitor —>Should be unique to environment, should be small letters without spaces
url = https://ec2-52-55-71-171.compute-1.amazonaws.com:9200/ –> update the elasticsearch URL port = 9200 username = elastic
password = VhAEO1xyR3SMzbNy38GWP85kG63a0/q5JQFgkXLb7SY= –> Encrypted
elasticseach password (to encrypt any password/Input see above) use_ssl = true [heartbeat] ip = [“127.0.0.1:SI_server”] —> [“ IP:servername”, “IP:servername”] —> Will get
details from Step1 urls = [https://ec2-52-55-71-171.compute1.amazonaws.com:9200/:URL_Name] —> Will get details from Step1 schedule_heatbeat_seconds=60 [systemstats] schedule_system_stats_second=60 environment=general - Provide the required permissions to the required packages as shown below:
chmod 755 Systemstats* chmod 755 Heartbeat* - Now run the heartbeat using below command nohup ./Heartbeat/Heartbeat >/dev/null2>&1 & nohup./Systemstats/Systemstats >/dev/null2>&1 &
- Check the status of the heartbeat if it is started or not using below command ps ef | grep
Systemstats
ps -ef | grep heartbeat
2.6 IANN Monitor Project jar deployment
• In Javis/Linux/Server, you will be having IANN Monitor Api package.
• Move to the IANN Monitor_Api directory by using this command: cd IANN Monitor_API
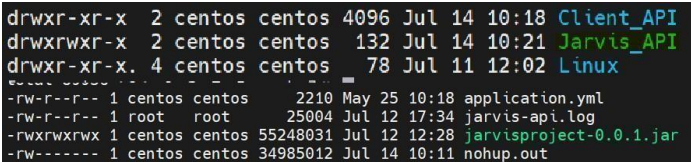
- After entering the IANN Monitor_API directory, please upload the .jar file and application.yml into the present location.
- Edit the application.yml file with database details and port mentioned in the below image by using this command.
- Note: Will get details from Step8 vi application.yml
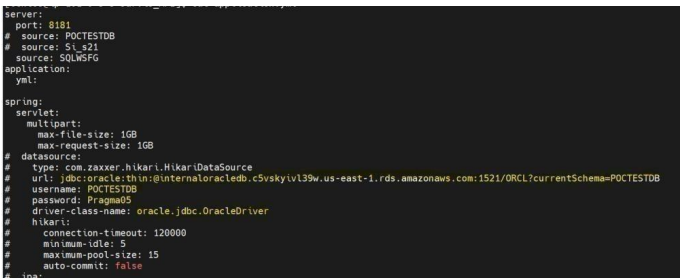
- After adding the configurations save the application.yml file by clicking on Esc button in keyboard and using the command below. 21 of 35 :wq!
- Now start the .jar file by using the below command nohup /java -Xms1g -Xmx8g -jar IANN Monitorproject0.0.1.jar> /dev/null 2>&1 &
- Check the status of the jar by using this command to see if pid is generated or not. ps -ef | grep IANN Monitorproject-0.0.1.jar

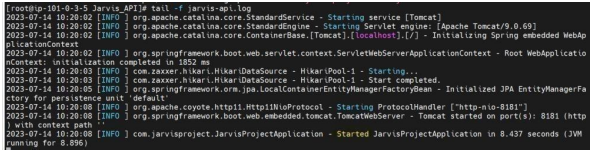
• Check the logs by using below this command tail –f IANN Monitorapi.log
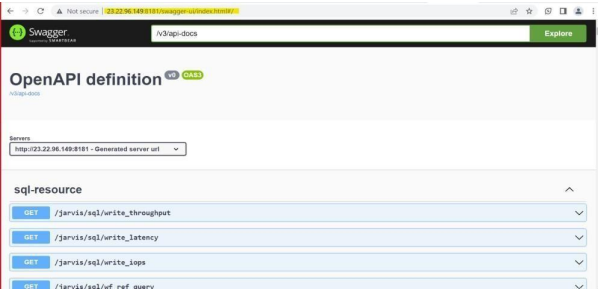
- Access the application URL in browser and check if you can access it http://<ip/dns>:/swagger-ui/index.html#/ by providing username and password of swagger username: IANN Monitor Password: password
2.6 Configuration of auto restart of IANN Monitor beats
Method 1 2.6.1.a Using crontab
- Download the IANN Monitor_beats_start.sh & run_IANN Monitor_beats_start.sh files from the bitbucket or S3 and upload to IANN Monitor client/server folder.
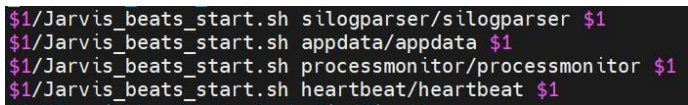
- Edit the run_IANN Monitor_beats_start.sh file with the IANN Monitor agent names installed in the server using vi run_IANN Monitor_beats_start.sh as shown below and save the file with Esc:wq!
• Schedule the jobs using crontab (make sure to mention correct directory path in below) crontab -e (this will open vi editor)
*/1 * * * * /run_IANN Monitor_beats_start.sh >> /restart_beat.log Ex: for sample path is: /home/centos/IANN Monitor/Client
*/1 * * * * /home/centos/IANN Monitor/Client/run_IANN Monitor_beats_start.sh /home/centos/IANN Monitor/Client >> /home/centos/IANN Monitor/Client /restart_beat.log

2. Verification
Stop any one of the beats by using kill -9 which is running and wait for 1-2 minutes the beat will be started automatically.
Or
Restart the system and wait a few minutes for all of the beats that have been configured to start automatically.
(OR)
Method 2: Here are the steps to Start and Stop the Agents using Systemctl Services
2.6.1. b Systemstats.service file
- To create this service file, you will need to create a file called Systemstats.service in the directory /etc/systemd/system/. Save the below text as the contents of the file.
Systemstats.service
[Unit]
Description=Systemstats
After=network.target
[Service]
Type=simple
ExecStart=/bin/bash -c “/home/centos/systemstats/systemstats > /dev/null 2>&1”
WorkingDirectory=/home/centos
User=Centos
Group=centos
Restart=always
[Install]
WantedBy=multi-user.target
Note: In ExecStart you must provide the location where IANN Monitor Agent is placed and In WorkingDirectory you have provide the location of the IANN Monitor Agent. For each Agent we need to create the service file (Appdata, Silogparser, Sterling reports, Database
health check, Heartbeat …etc)
- This service file will run the systemstats script in the background, ignoring any hangups. The script will be executed as the user Centos and the group centos. The service will be restarted automatically if it stops or crashes.
- Once you have created the service file, you will need to reload systemd: sudo systemctl daemon-reload
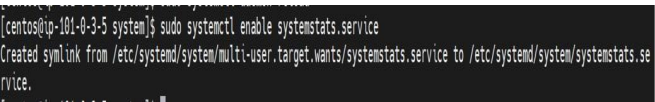
- Then, you can enable and start the service: sudo systemctl enable systemstats.service
- Once after enabling the service, it will create symbolic link and confirms as follows:
- Once after enabling the service, we need to start the service using following command
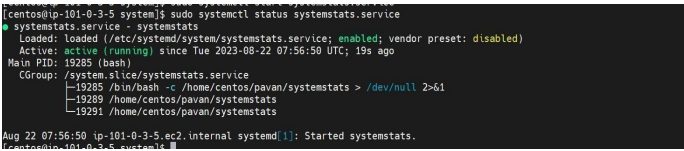
sudo systemctl start systemstats.service - To check the status of the service, use the following command: sudo systemctl status systemstats.service
- This will display the status of the service, whether it is running, stopped, or enabled.
2.6.2.a Configuration of auto restart
- Use the following command to stop the service sudo systemctl stop systemstats.service
- In the same way, create a systemd service file for Elasticsearch, Kibana, heartbeat, systemstats and UI using the following content in the directory /etc/systemd/system/.
- Save the text below as the contents for each file.
Note: Instead of using cron jobs, we can schedule a job in Control-M to run every minute for
IANN Monitor to track live data
Configuration of auto restart of IANN Monitor Applications
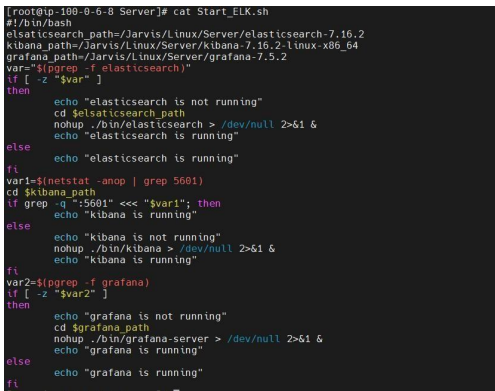
Method 1:Configuring auto-restart beat for Elasticsearch, Kibana and UI with crontab
- Open ELK_Start.sh file with vi editor and update the paths of elasticsearch, Kibana &
UI as shown below elsaticsearch_path=/IANN Monitor/Linux/Server/elasticsearch7.16.2
kibana_path=/IANN Monitor/Linux/Server/kibana7.16.2-linux-x86_64 ui_path=/IANN
Monitor/Linux/Server/ui
After updating, save the file with Esc:wq!
- Now, give executable permissions to ELK_Start.sh file shown below chmod 755 ELK_Start.sh
- Add the cron jobs as shown below by opening crontab with crontab -e
*/1 * * * * /IANN Monitor/Linux/Server/Start_ELK.sh /IANN Monitor/Linux/Server >> /IANN Monitor/Linux/Server/elk_restart_beat.log - To list the cron jobs created use the below command crontab -l

Verification: Once after scheduling the cron jobs, all the IANN Monitor applications will get
started/check the status after one minute. Whenever they are stopped, they will be autorestarted.
(OR) Method
2.6.2. b Elasticsearch.service file
• Create a service file in /etc/systemd/system/ location as shown below
Elasticsearch.service
[Unit]
Description=elasticsearch
After=network.target
ExecStart=/home/IANN Monitor/IANN MonitorPackage/Server/elasticsearch-
8.12.2/bin/elasticsearch WorkingDirectory=/home/IANN Monitor/IANN
MonitorPackage/Server/elasticsearch-8.12.2/bin User=IANN Monitor
Group=IANN Monitor
Restart=always
[Install]
WantedBy=multi-user.target
• This service file will run the elastic search script as a background process, ignoring any hangups. The script will be executed as the user IANN Monitor and the group IANN Monitor. The service will be restarted automatically whenever it stops or crashes.
• Once you have created the service file, we need to reload systemd service:
sudo systemctl daemon-reload
•Then, you can enable and start the service: sudo systemctl enable elasticsearch.service
• Once after the enabling the service, it will create symbolic link
• Once after the enabling the service, we need to start the service using following command
sudo systemctl start elasticsearch.service
• To check the status of the service, use the following command: sudo systemctl status elasticsearch.service
• This will display the status of the service whether it is running, stopped, or enabled.
Note: Instead of using cron jobs, we can schedule a job in Control-M to run every minute for IANN Monitor to track live data
2.6.3 kibana.service file
• Create a Kibana.Service file in /etc/systemd/system/ location as shown below
[Unit]
Description=kibana
After=network.target
ExecStart=/home/IANN Monitor/IANN MonitorPackage/Server/kibana-8.12.2-
linuxx86_64/bin/kibana WorkingDirectory=/home/IANN Monitor/IANN
MonitorPackage/Server/kibana-8.12.2-linux-x86_64/bin User=IANN Monitor
Group=IANN Monitor
Restart=always
[Install]
WantedBy=multi-user.target
• This service file will run the Kibana script in the background, ignoring any hangups. The script will be executed as the user IANN Monitor and the group IANN Monitor. The service will be restarted automatically if it stops or crashes.
• Once you have created the service file, we need to reload systemd service:
sudo systemctl daemon-reload
•Then, you can enable and start the service:
sudo systemctl enable kibana.service
• Once after enabling the service, it will create symbolic link
• Once after enabling the service, we need to start the service using following command
sudo systemctl start kibana.service
• To check the status of the service, use the command below:
sudo systemctl status kibana.service
• This will show you the status of the service, whether it is running, stopped, or enabled.
2.6.4 IANN Monitor_UI.service file
• Create a IANN Monitor_UI.service file in /etc/systemd/system/ location as shown below
[Unit]
Description= IANN Monitor_UI
After=network.target
[Service]
ExecStart=/bin/bash -c “/usr/bin/java -Dspring.profiles.active=IANN Monitor -jar <location to Ui jar> JES.IANN Monitor.jar /dev/null 2>&1 &” — for general profile
ExecStart=/bin/bash -c “/usr/bin/java -Dspring.profiles.active=saml -jar <location to Ui jar> JES.IANN Monitor.jar /dev/null 2>&1 &” — for saml profile
WorkingDirectory= <location to Ui jar>
User= IANN Monitor
Group= IANN Monitor
Restart=always
[Install]
WantedBy=multi-user.target
• This service file will run the IANN Monitor UI script in the background, ignoring any hangups. The script will be executed as the user IANN Monitor and the group IANN Monitor. The service will be restarted automatically if it stops or crashes.
• Once you have created the service file, you will need to reload systemd service:
sudo systemctl daemon-reload
• Then, you can enable and start the service:
sudo systemctl enable IANN Monitor_UI.service
• Once after enabling the service, it will create a symbolic link
• Once after enabling the service, we need to start the service using the following command:
sudo systemctl start IANN Monitor_UI.service
• To check the status of the service with the following command below:
sudo systemctl status IANN Monitor_UI.service
• This will show you the status of the service whether it is running, stopped, or enabled.
2.6.5 Api_Jar.service file
• Create an API_Jar.service file in /etc/systemd/system/ location as shown below
[Unit]
Description= IANN Monitor_Api
After=network.target
[Service]
Type=simple
ExecStart=/bin/bash -c “/usr/bin/java -Xms1g -Xmx8g -jar <location to API jar>IANN Monitorproject-0.0.2.jar”
WorkingDirectory=<location to API jar>
User=centos
Group=centos
Restart=always
[Install]
WantedBy=multi-user.target
• This service file will run the API jar script in the background, ignoring any hangups.
The script will be executed as the user centos and the group centos. The service will be restarted automatically if it stops or crashes.
• Once you have created the service file, you will need to reload the system service:
sudo systemctl daemon-reload
• Then, you can enable and start the service:
sudo systemctl enable API_Jar.service
• Once after enabling the service, it will create a symbolic link
• Once after enabling the service, we need to start the service using the following command:
sudo systemctl start API_Jar.service
• To check the status of the service with the following command below:
sudo systemctl status API_Jar.service
• This will show you the status of the service, whether it is running, stopped, or enabled.
• Similarly, follow 1.6.1 steps for creating service files for heartbeat as well.
Note: Instead of using cron jobs, we can schedule a job in Control-M to run every minute for IANN Monitor to track live data.
3. Client deployment
3.1 Download package
• Download the package from BITBUCKET using Git Clone command or download to Local and uploading to the server Example: git clone https://@bitbucket.org/PragmaEdge_Teams/IANN Monitor_linux.git
• Extract the ZIP file once the package is in place unzip client.zip • In IANN Monitor/Linux/Client all the client beats will exists
3.1.1 Configuration changes
In config.ini file, all the IANN Monitor client beats need to be configured.
[elasticsearch]
index = index_name (Need to provide required index name related to project)
url = https://elasticserachurl:9200/ (Need to provide Elasticsearch URL)
port = 9200
username = elastic
password = eX83i9dP3PpIZgzvipIt1NqFy/lqZlz7hAKUA5Xxp9Y= (Need to provide encrypted password)
use_ssl = True
[appdata]
api_host = http://apiurl:9090 (Need to provide IANN Monitor API URL)
IANN Monitor_username = IANN Monitor
IANN Monitor_password = 8o3DjuRtTlvaqzbehivjk75p77pnUsnTBZSVPdQUVfw=
db_type = DB2 (Need to provide type of database)
scheduled_seconds = 300
Waiting_count_version = true
Halted_count_version = true
list=(‘/ceuroot/AL875’, ‘/abc’)
days = 3
adapter_list = (‘adapters’) (Will get details from Step 9)
service_list = (‘services’) (Will get details from Step 9)
schedulers_list = (‘schedulers’) (Will get details from Step 9)
archive = true
index = true
purge = true
#get_mailbox_depth_query = false
get_mailbox_ref_query = true
document_processed = true
db_usage = true
mailbox_long_running = true
run_time_of_service = true
adapter_status = true
adapter_uptime_status = true
halted_count = true
halting_count = true
interrupted_count = true
waiting_count = true
waiting_on_io_count = true
Purge_count = true
app_availability_time = true
schedulers_status = true
Non_index = false
Bp_status = false
get_mailbox_depth = true
external_perimeter = true
active_count = false
get_mailbox_depth_seconds = 300
document_processed_seconds = 300
db_usage_seconds = 300
external_perimeter_seconds = 60
adapter_status_seconds = 60
halted_count_seconds = 300
halting_count_seconds = 300
interrupted_count_seconds = 300
waiting_count_seconds = 300
waiting_on_io_count_seconds = 300
active_count_seconds = 300
archive_seconds = 300
index_seconds = 300
purge_seconds = 300
app_availability_time_seconds = 300
schedulers_status_seconds = 300
run_time_of_service_seconds = 300
adapter_uptime_status_seconds = 300
bp_status_seconds = 300
non_index_seconds = 300
mailbox_long_running_seconds = 300
[db_healthcheck]
bp_locks_minutes = 30
days = 10
over_all_database_size = true
database_check = true
tablespace_usage = true
active_sessions = true
inactive_sessions = true
total_sessions = true
current_blocked_sessions = true
invalid_object_status = true
unusable_indexe = true
database_locks = true
db_response_time = true
lifespan = false
top_tables = true
mailboxes_with_unextracted_messages = true
mailboxes_with_unextracted_messages_older_than_ndays = true
mailboxes_with_extracted_messages = false
no_of_messages_extracted_older_n_days = true
mailbox_with_unextracted_messages_older_than_ndays = true
purge_locks = true
cluster_status = false
redolog_group_status_check = true
Amount_of_Redo_Generated_per_Hour = true
redo_generation_per_day = true
redo_file_change = true
cpu_util = true
ram_util = true
db_conn = true
write_latency = true
read_latency = true
read_iops = true
write_iops = true
read_throughput = true
write_throughput = true
over_all_database_size_seconds = 1800
database_check_seconds = 60
tablespace_usage_seconds = 1800
active_sessions_seconds = 1800
inactive_sessions_seconds = 1800
total_sessions_seconds = 1800
current_blocked_sessions_seconds = 1800
invalid_object_status_seconds = 1800
unusable_indexes_seconds = 1800
database_locks_seconds = 1800
db_response_time_seconds = 1800
lifespan_seconds = 1800
top_tables_seconds = 1800
mailboxes_with_unextracted_messages_seconds = 1800
mailboxes_with_extracted_messages_seconds = 1800
no_of_messages_extracted_older_n_days_seconds = 1800
mailbox_with_unextracted_messages_older_than_ndays_seconds = 1800
purge_locks_seconds = 300
cluster_status_seconds = 120
redolog_group_status_check_seconds = 1800
Amount_of_Redo_Generated_per_Hour_seconds = 1800
redo_generation_per_day_seconds = 1800
redo_file_change_seconds = 1800
cpu_util_seconds = 1800
ram_util_seconds = 1800
db_conn_seconds = 1800
write_latency_seconds = 1800
read_latency_seconds = 1800
read_iops_seconds = 1800
write_iops_seconds = 1800
read_throughput_seconds = 1800
write_throughput_seconds = 1800
[sterling_reports]
trusted_certs = true
ca_certs= true
system_certs = true
long_running_bp_steps = true
long_running_bp = true
bp_definition_details_for_si = true
bp_runs_bp_steps = true
no_execution_per_node = true
bp_records_per_month = true
bp_with_large_bp_steps = true
trusted_certs_seconds = 1800
ca_certs_seconds = 1800
system_certs_seconds = 1800
long_running_bp_steps_seconds = 1800
long_running_bp_seconds = 1800
bp_definition_details_for_si_seconds = 1800
bp_runs_bp_steps_seconds = 1800
no_execution_per_node_seconds = 1800
bp_records_per_month_seconds = 1800
bp_with_large_bp_steps_seconds = 1800
long_bp_steps_time_seconds = 1800
long_bp_time_seconds = 60
large_bp_steps = 3000
[ssp]
data = {“SSP Engine1 Adapters1”:[“192.168.0.26″,8444],”SSP Engine1 Adapters2”:[“192.168.0.55”,10000]}
delay = 60
[process_monitor]
process_list = [“Jar_names”]
schedule_process_monitor_seconds = 60
Save and exit the config.ini file when details are updated.
3.2. Installation of IANN Monitor Agents
3.2.1 : Providing permissions
Give the required permissions to appdata, sireports, dbhealthcheck, systemstats, queuewatcher, Silogparser, downtime_report and SSP_heartbeat as shown belowPCp chmod 755
Note: Give executable permissions for all the client beats
3.2.2 : Configure restart beats
Please refer to step 1.6 and schedule cronjobs (or) create service files for all the IANN Monitor client agents
Note:
appdata, sireports and dbhealthcheck need to be executed on only one SI-Node if the rest of the nodes in cluster use same database.