To login into FileGPS Application, we have different roles to access the application which includes super admin, Admin, Data admin, Business User, business admin, business user executive and File Operator.
These are the below input elements that are present in the Login screen.
• Username
• Password
• Show Password
• Login (redirects to Dashboard Screen after successful login).
• Forgot Password
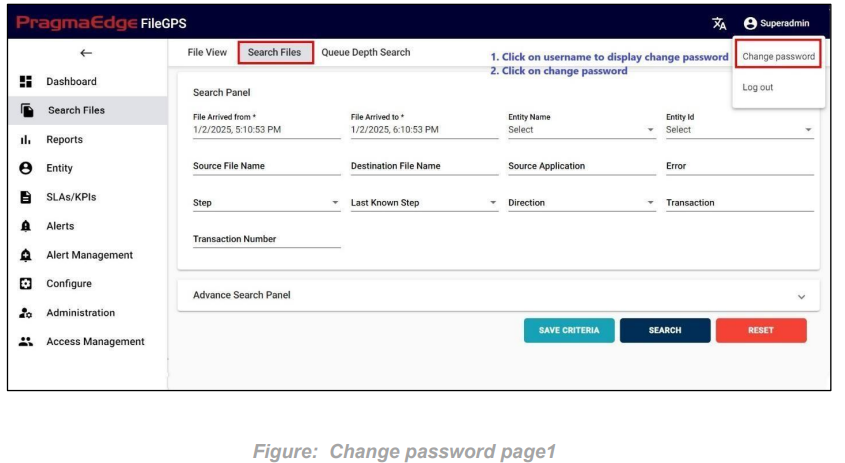
On the Login screen enter the Username and password related to your account for filegps application and then click on login button. It will validate your user credentials and redirect to the home screen of Search file page with user role on the right corner of the header section on top.

If you forgot your password, you could easily reset it using the forgotten password link on the login page. All you need is your email address. After entering the details. We can select “Forgot password?” link near the bottom of the login page. After clicking on the forgot password link it will redirect you to the next screen.

On the next screen, enter your email address. Click on the continue button and now check your email which was mentioned we will be sending an OTP (One Time Password) to change your password which will be validated for the next 24 hours. Please enter this one-time password on the next page.

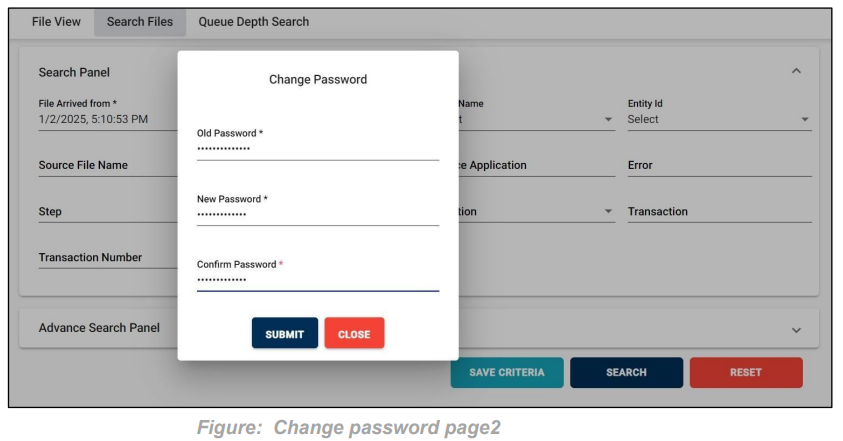
By giving the details in below mentioned screenshot as User ID of the user, New Password to change, Confirm Password of new password given, OTP (one time password) sent.

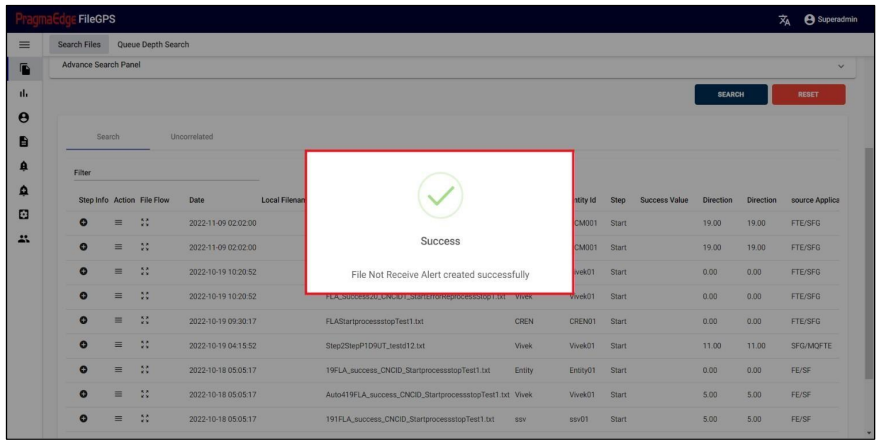
After providing the details click on the submit button which will successfully change the password to a success message.

- The header consists of the Pragma Edge Logo with product name ‘Pragma Edge FileGPS’ on the top left corner.
Toggle Switch: On clicking this, menu will collapse and vice-versa. Welcome message with username of the logged in user is displayed on the top right corner of this section
This panel is placed on the left side of the application which displays all operations tabs. where corresponding tabs redirect to their respective pages.

This panel has various fields which fetches the data upon the user search criteria. Based on the input user could perform actions on the data that is fetched or retrieved.

Login  Dashboard
We have a sub menu tab in the Search file page. This operation enables the user to search all kinds of Transaction files that were not processed.
Path:
Login File Life Cycle Uncorrelated
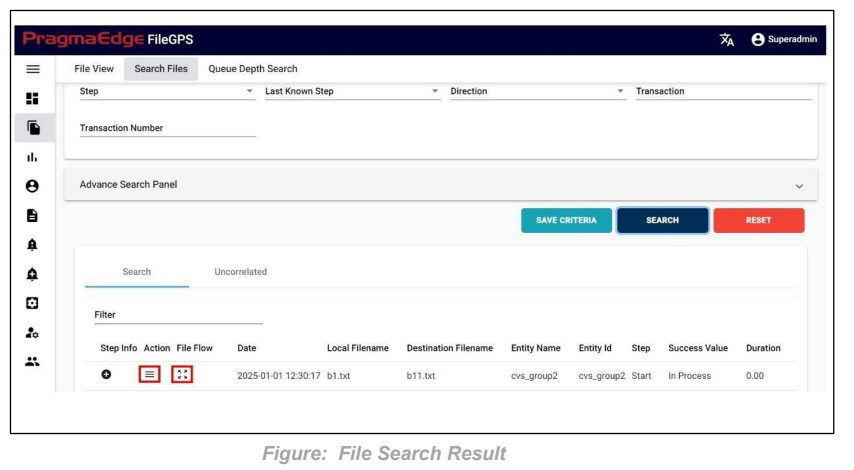
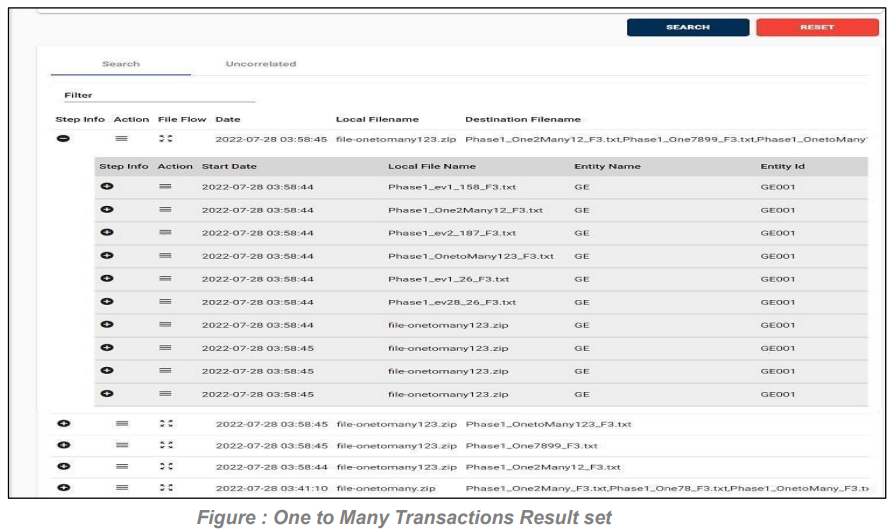
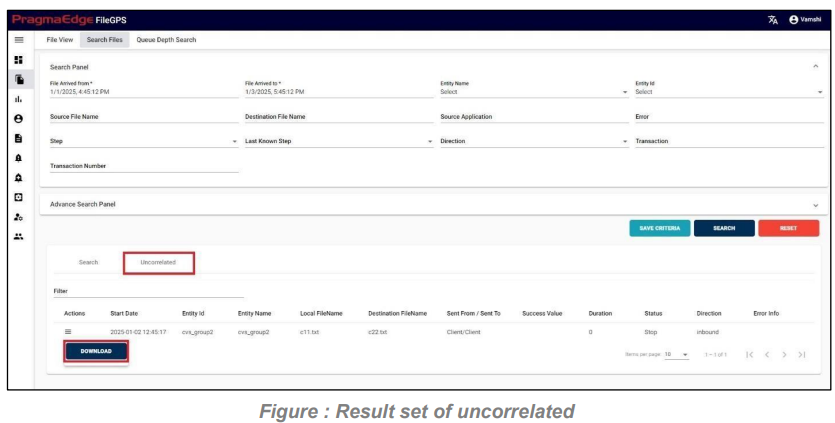
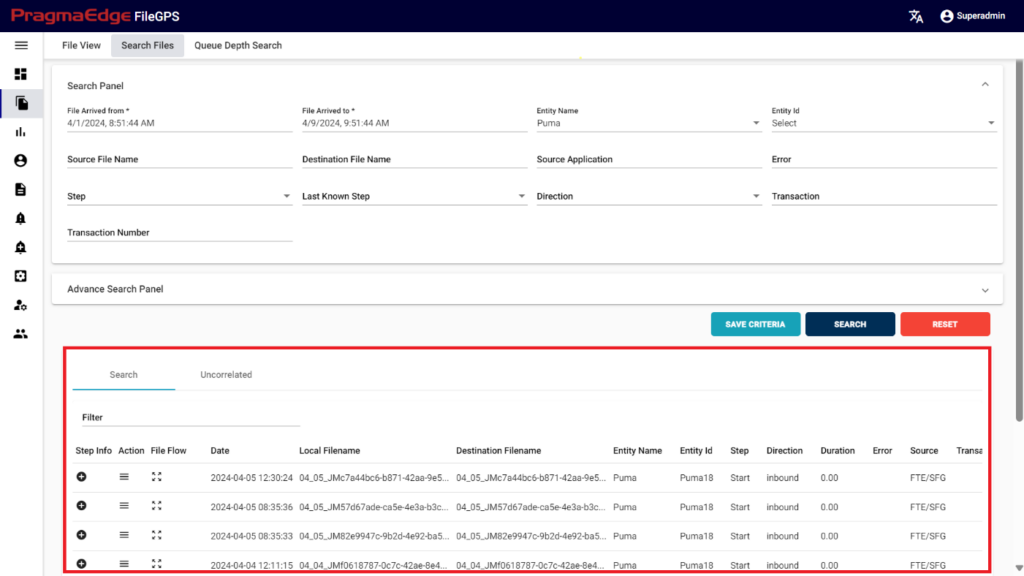
When the user searches the files with date ranges and other required fields as filters the resultant records will be displayed on a page where we can check both search and uncorrelated files. By default, we will get records of search which file transmission were completed change to the sub side menu uncorrelated which will display the transaction files which were not processed.
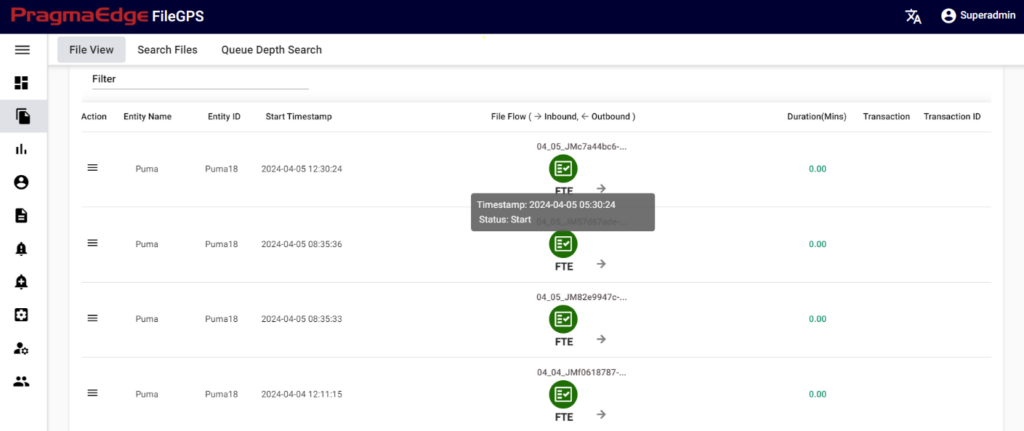
This screen enables the user to view the files that bypassed the ‘START’ stage.
In other words, the files contain only ‘PROCESS’ and ‘STOP’ events.
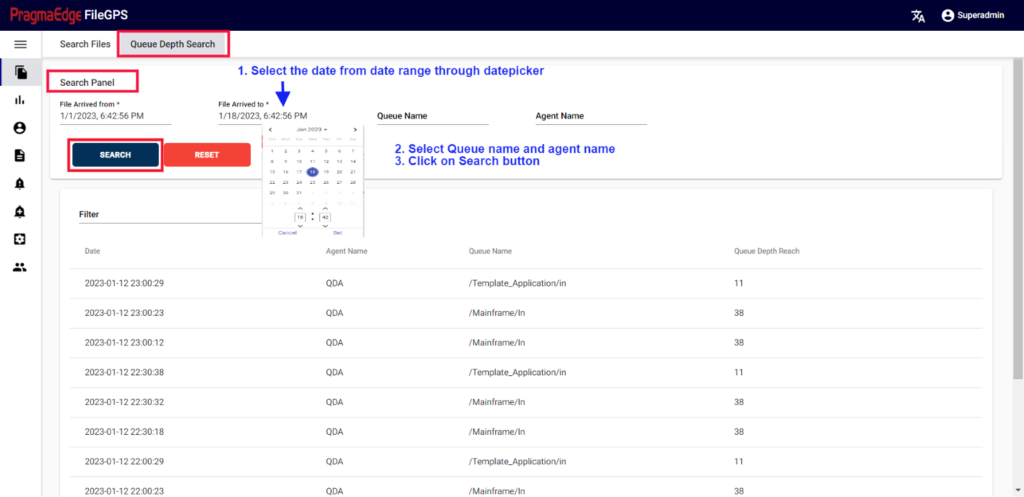
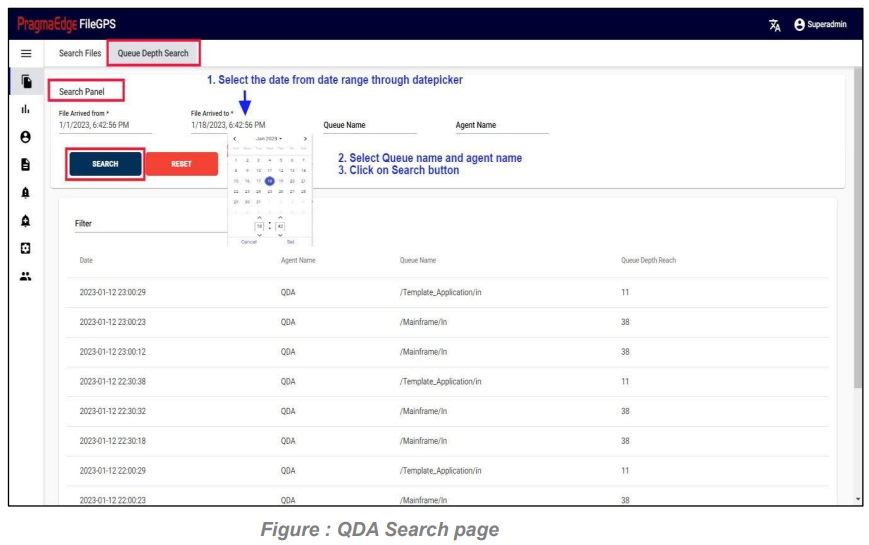
Queue Depth Search Provides the information regarding a file that was transmitted with its Queue Name and Depends on Queue Depth Reach and Agent Name
Path:
Login  Search Files Queue Depth Search
In this screen user can search for Queue Depth Search by giving File Arrived From date (The date on which file has arrived from Entity to Application) in the form of (mm/dd/yyyy hh:mm:ss) and File Arrived To date with date pickers provided. And enter with Queue Name and Agent Name.
This operation enables the user to search all kinds of Transaction files that were processed.
Path:
Login  Search Files File View
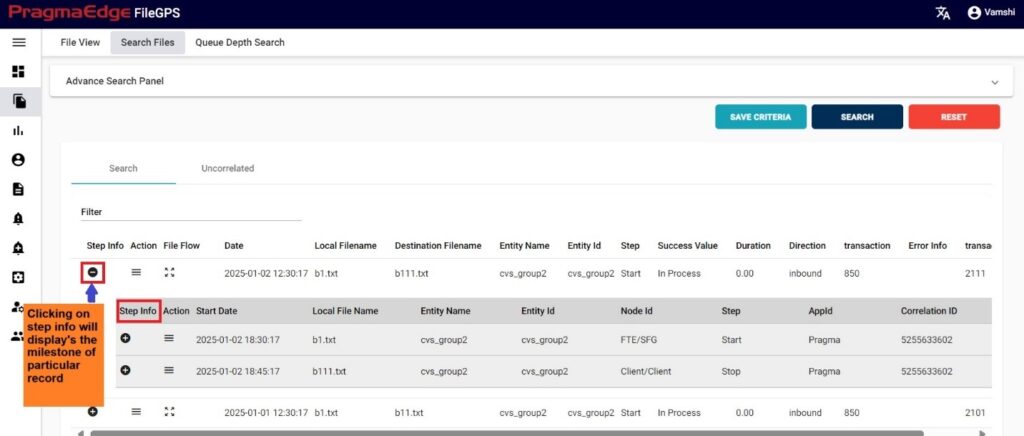
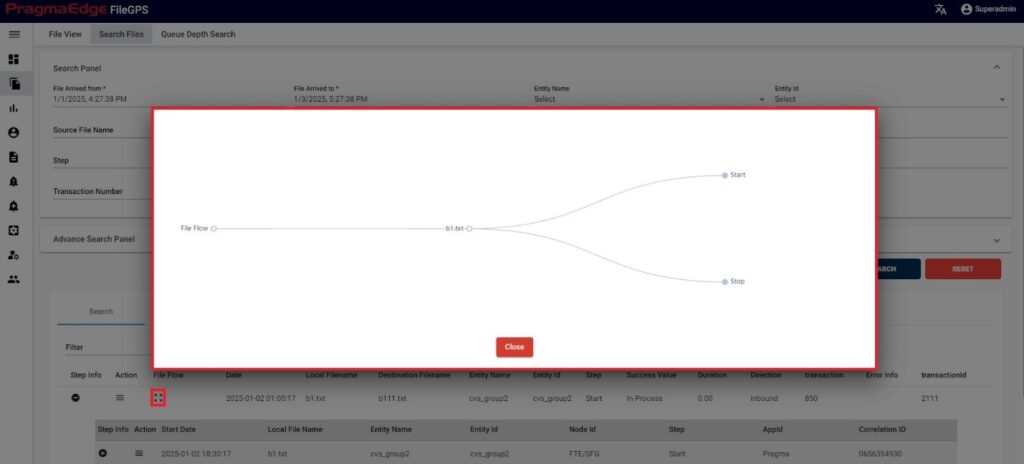
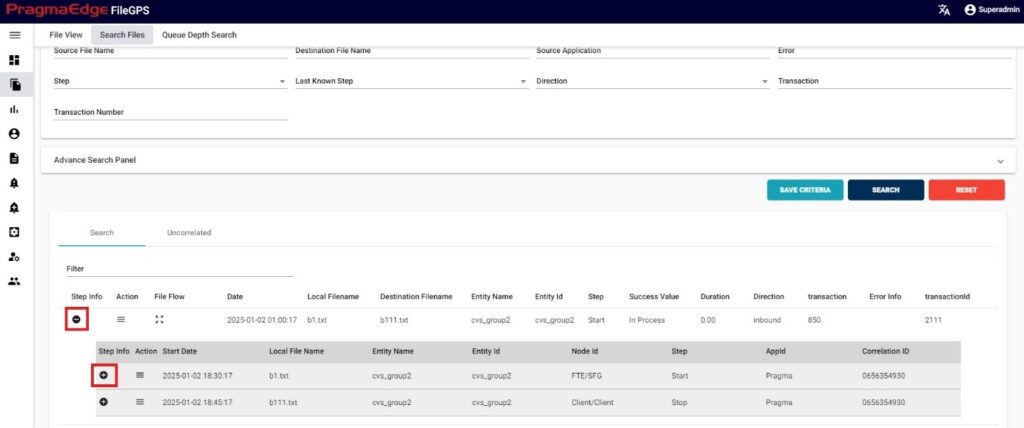
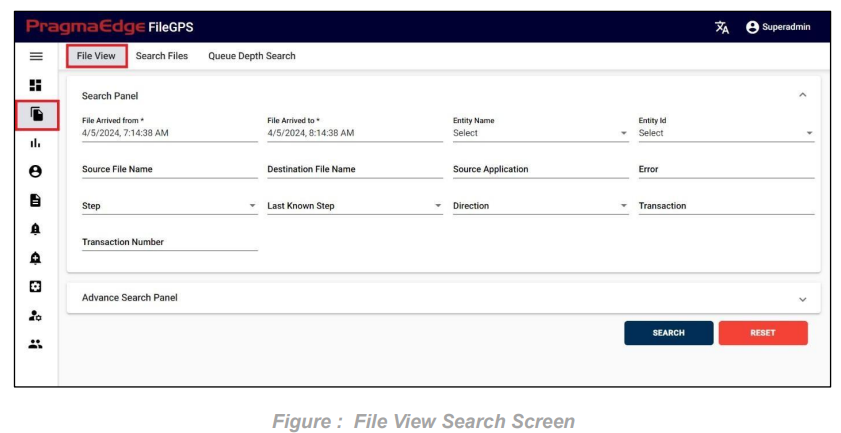
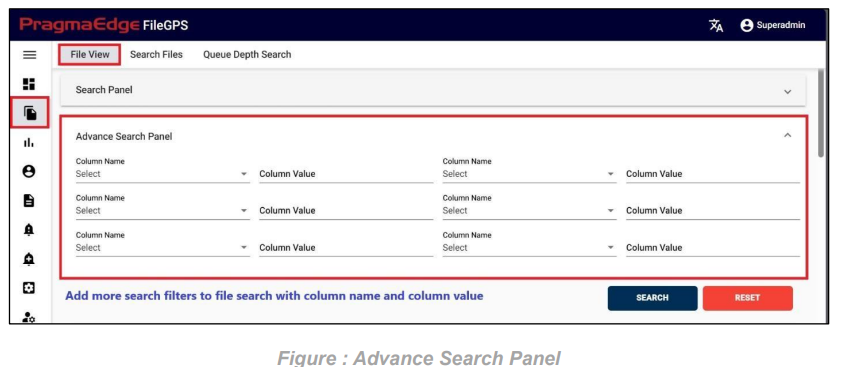
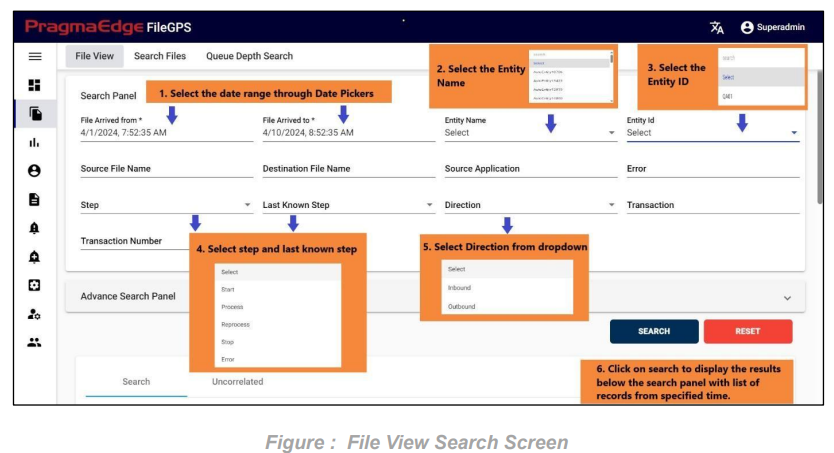
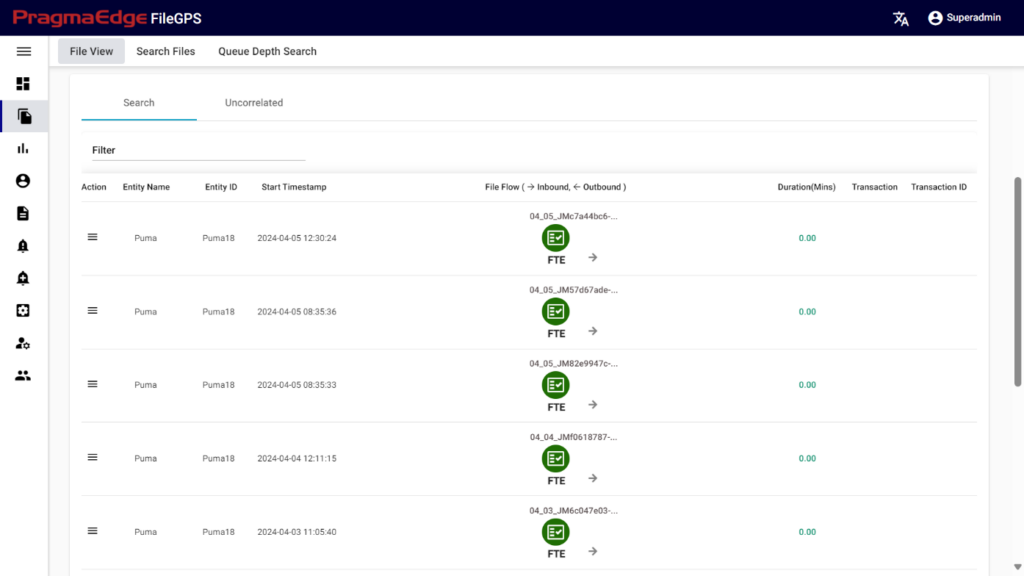
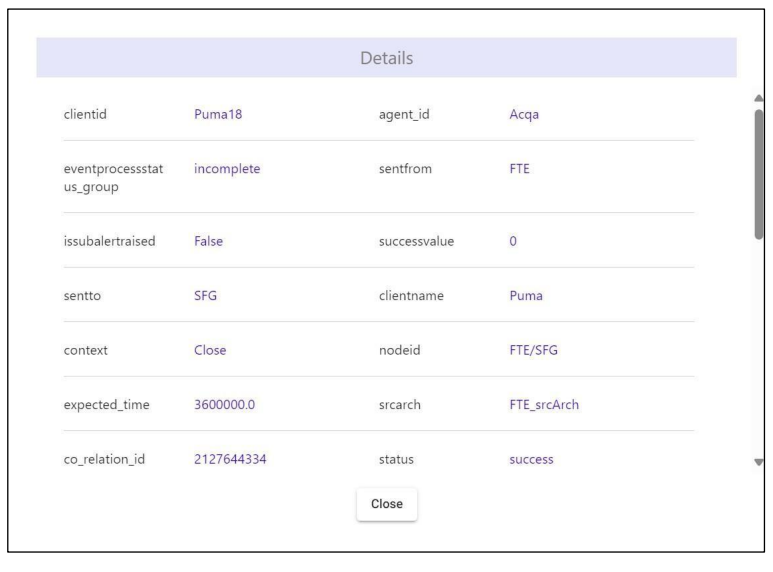
File View is an advanced and visually enhanced version of our file search functionality. With File View, users can search and monitor files, users can view different hops and directions of file transactions in a cleaner way.
Path:
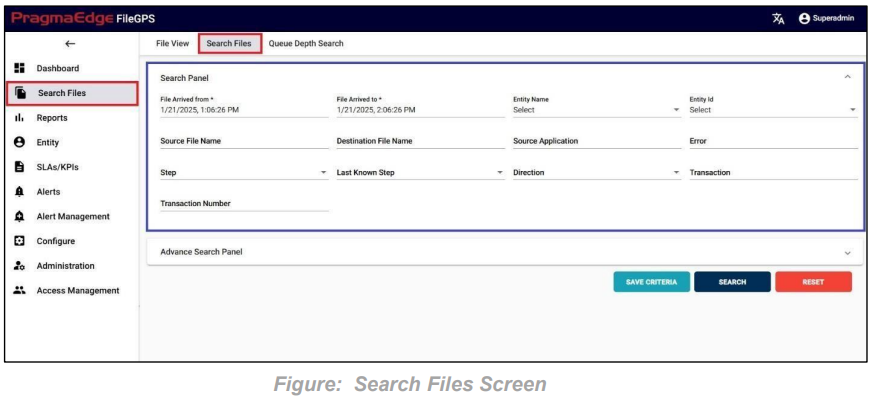
Login  Search Files Search Files
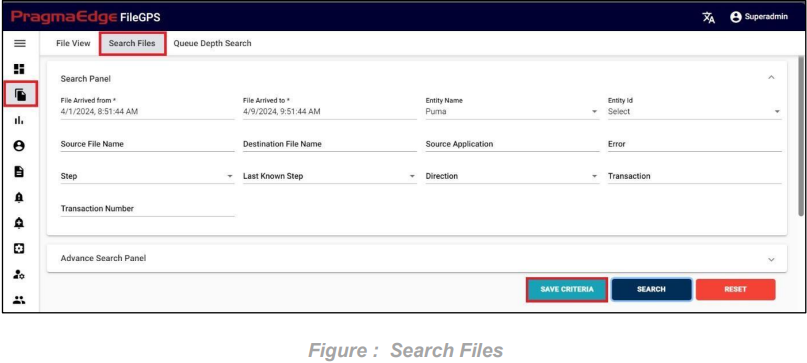
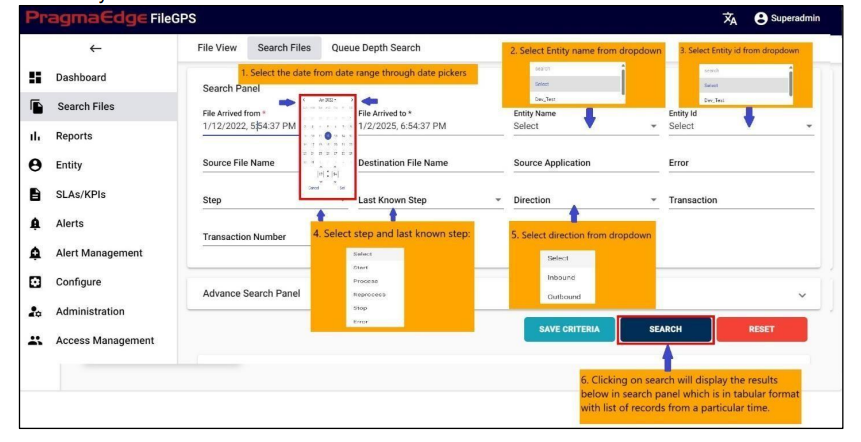
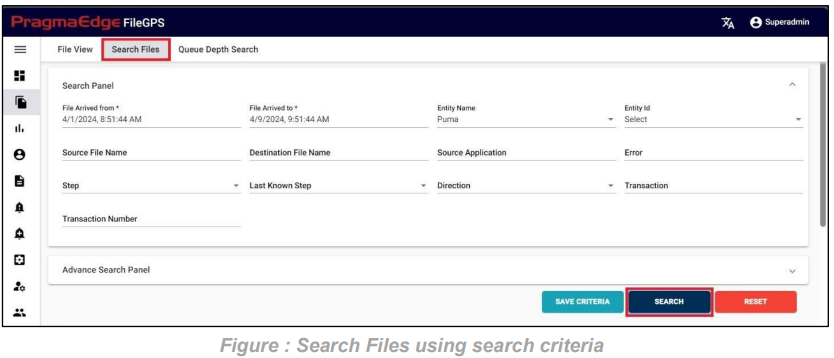
Users can now save their search criteria, including entity name, entity ID, or step, removing the need to re-enter them for each search. This feature is tailored to individual user preferences, streamlining workflows and simplifying the overall process.
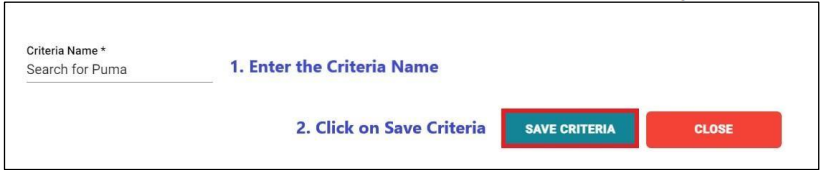
Select the File Arrived from and File Arrived to through date pickers, apply the desired filters and click on save criteria button to save the search criteria.
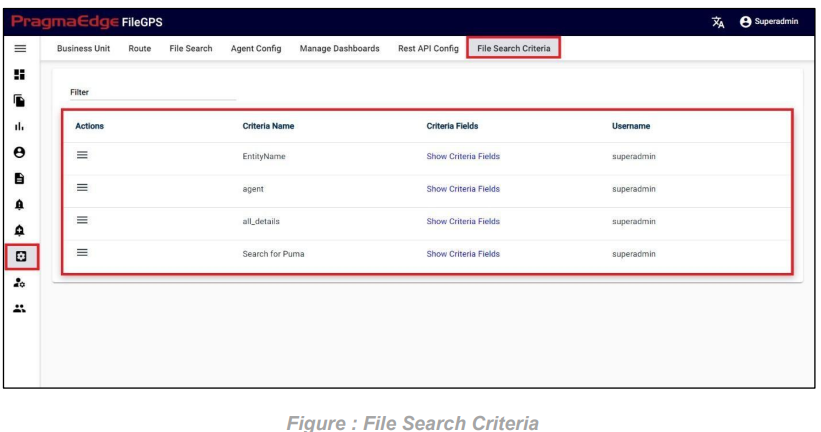
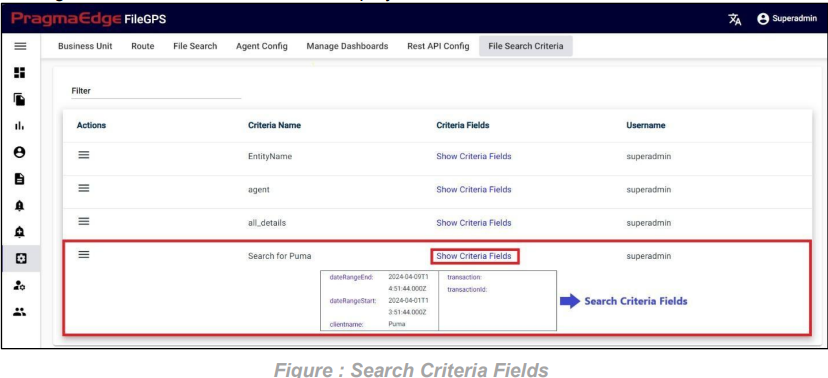
For example, the entity name has been selected, and the criteria have been saved as shown in
the figure below.
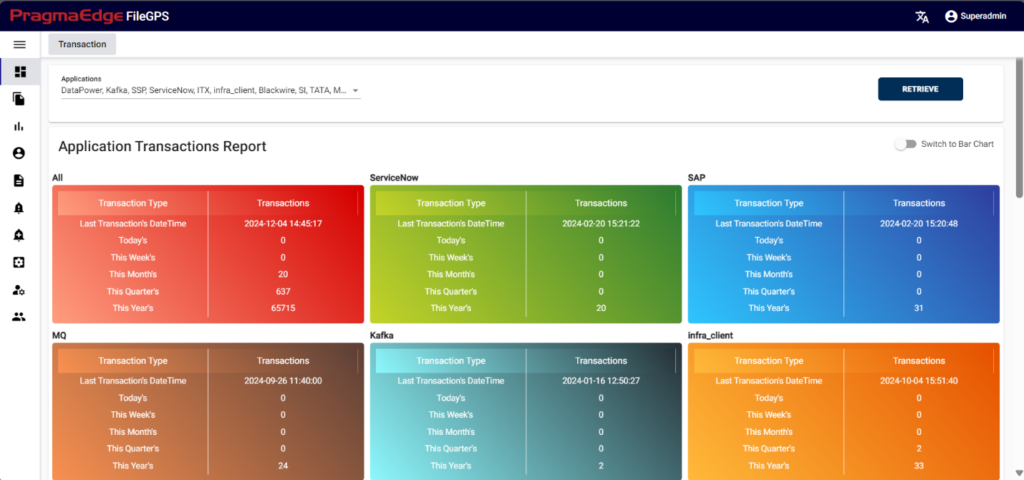
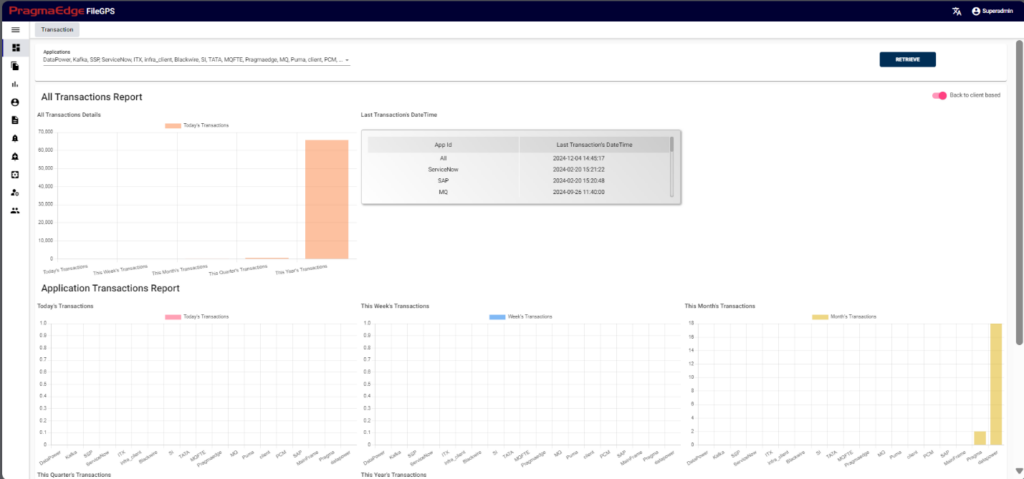
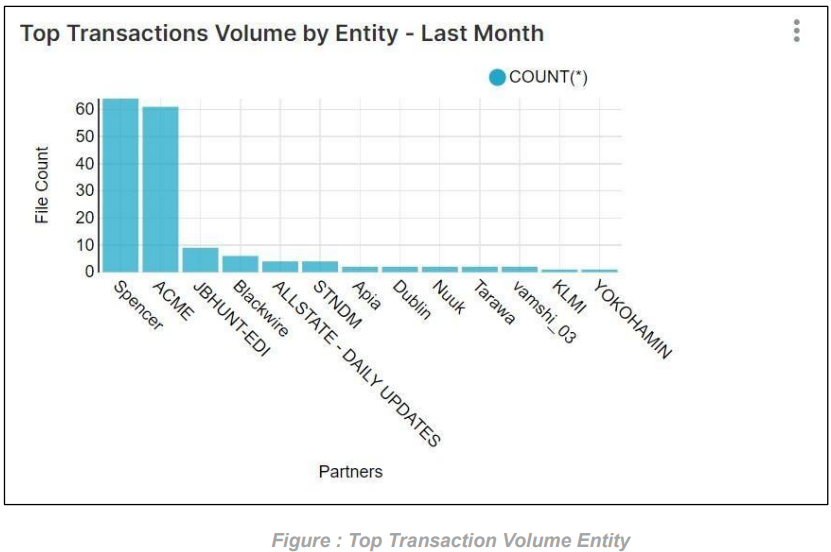
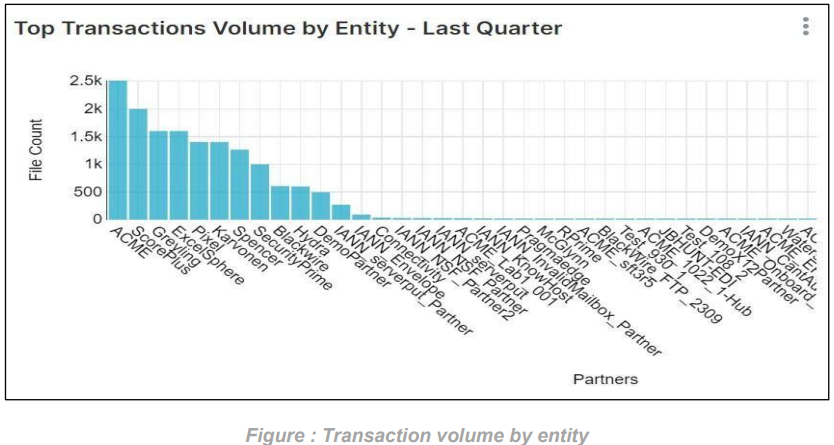
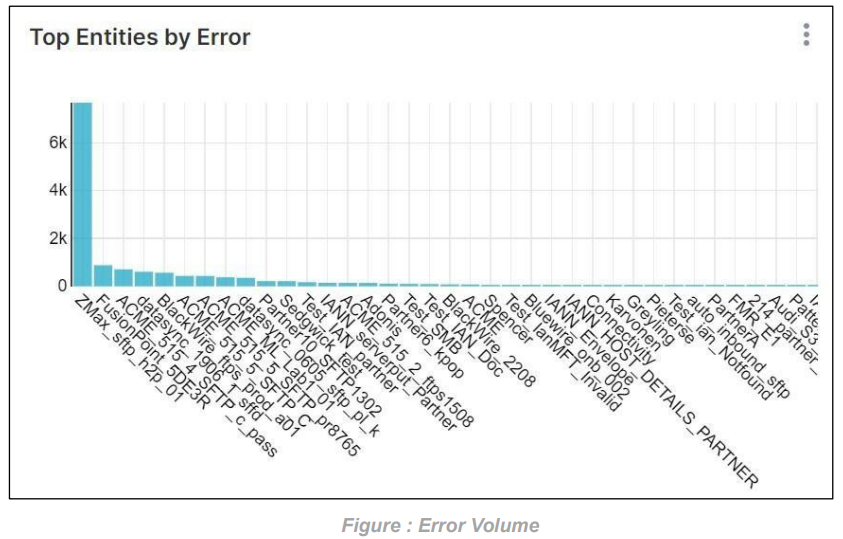
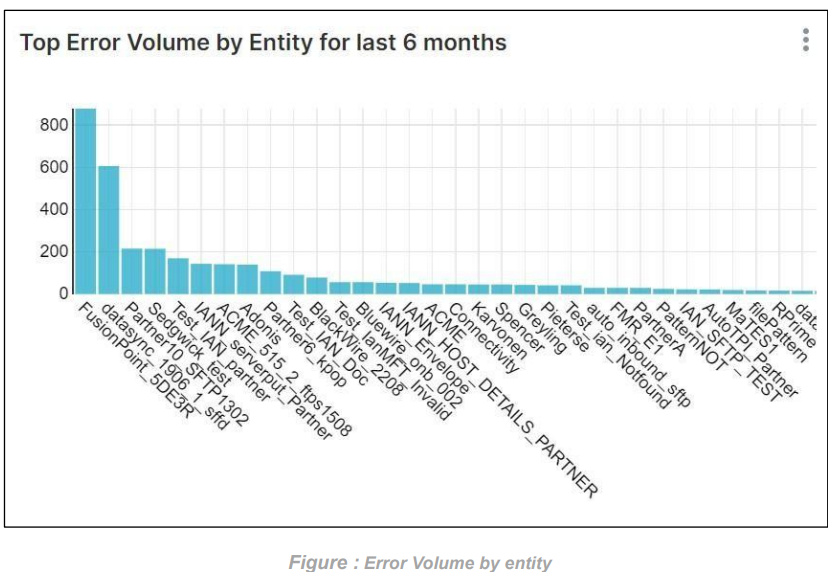
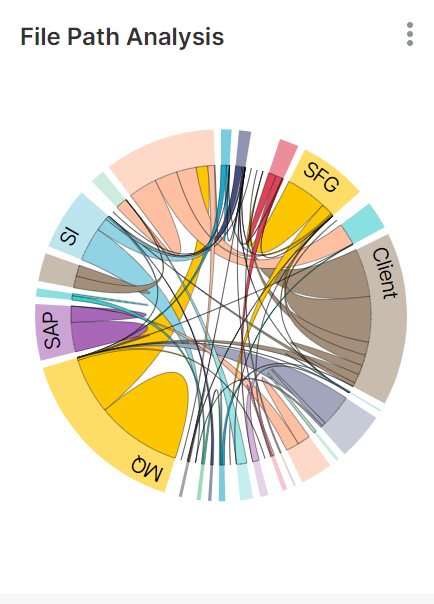
FileGPS Reports are the Infographics that depict the statistics of the data that was processed between the hubs.
Path:
Login Reports
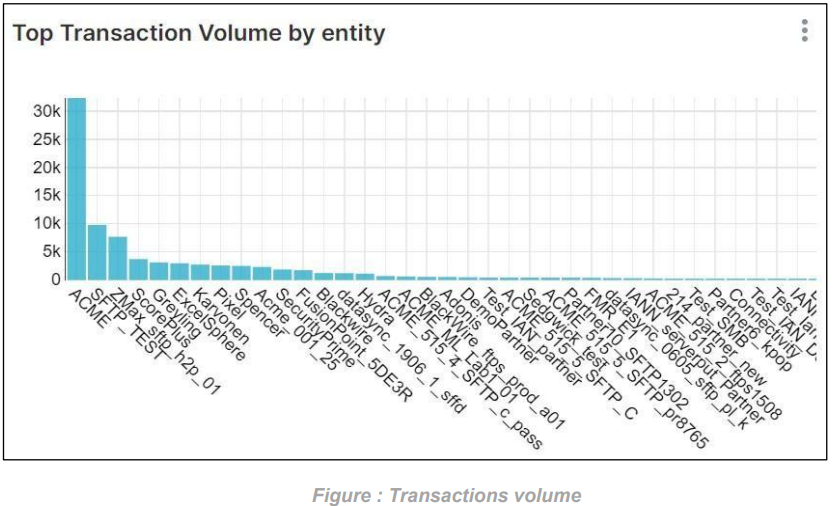
Reports provide diversified options to view the file statistics
We have multiple graphs in dashboard module, where we can give inputs to generate the reports. This dashboard reports represent different kinds of Line & Bar Graphs regarding information of missed SLA, top missed SLA entity, missed SLA by entity, transactions volume, top transactions volume entity, transactions volume by entity, error volume, error volume by entity.
Path: Login Entity
This module of the FileGPS application provides the user with the ability to perform various operations on entity. These are various operations
• Create Entity
• Manage Entity
• Create File Name Pattern
• Manage File Name Pattern
Path:
Login Entity Create Entity
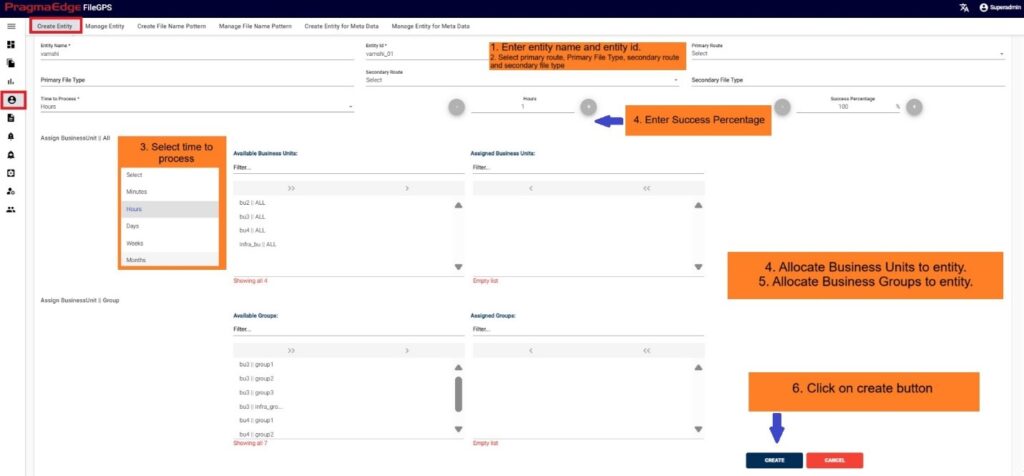
In this screen, to onboard an Entity, the User can create an Entity and Unique ID and assign business Partners and groups to it.
For example, in this scenario ACME Entity details are provided in the ‘Create Entity’ sub tab to create an entity as shown below Figure.
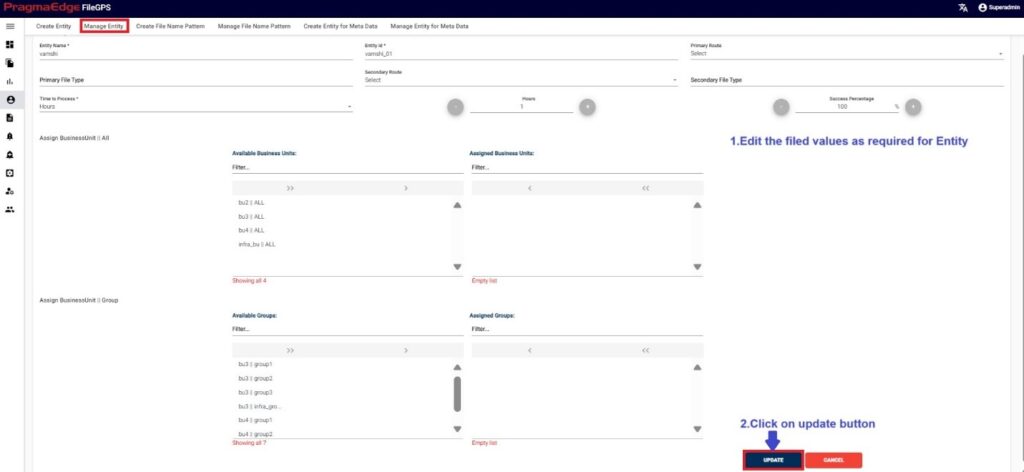
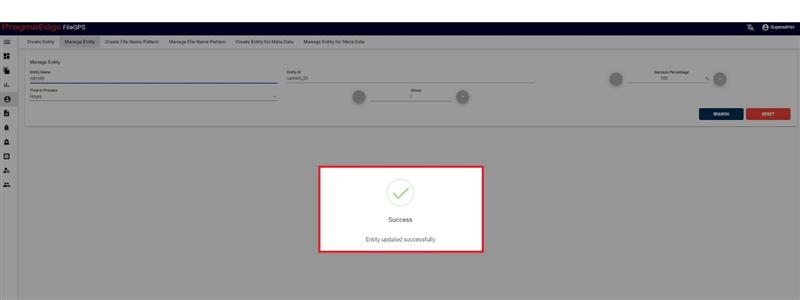
In Manage entity, User can search for the entities based on the filters that were provided at the time of entity creation.
Path:
Login Entity Manage Entity
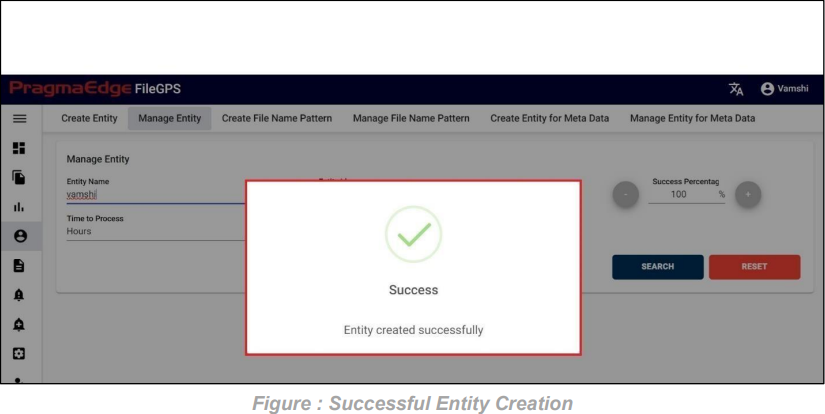
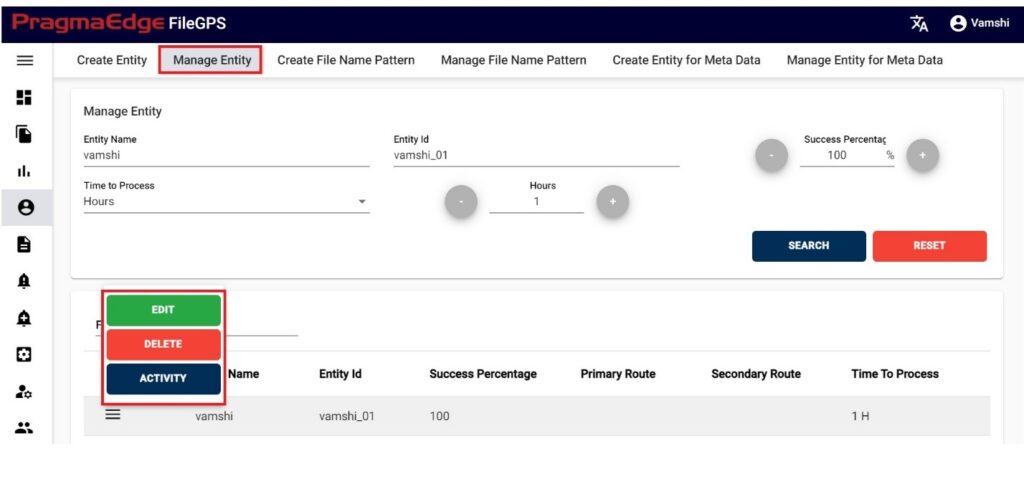
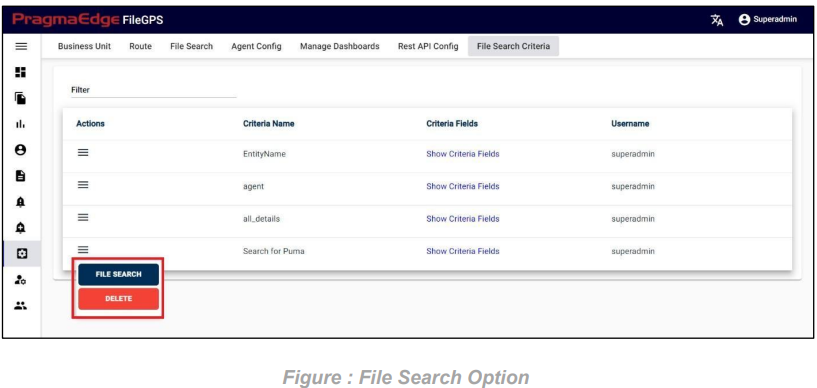
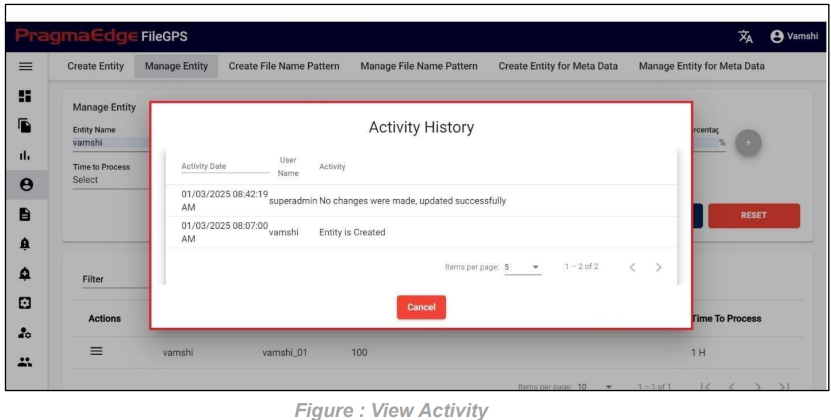
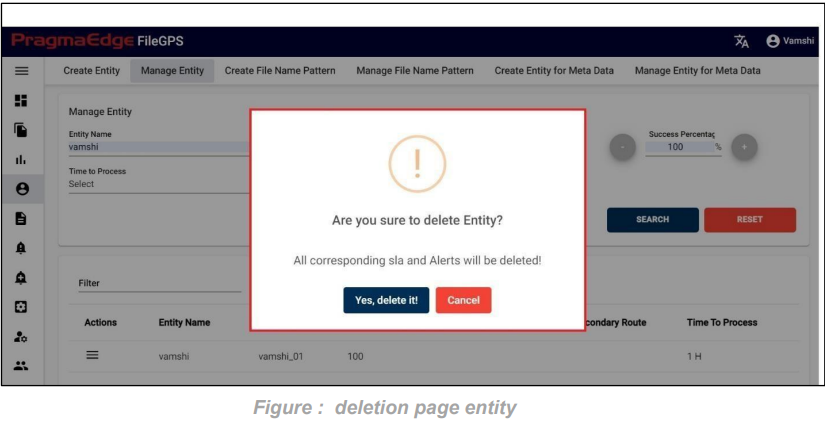
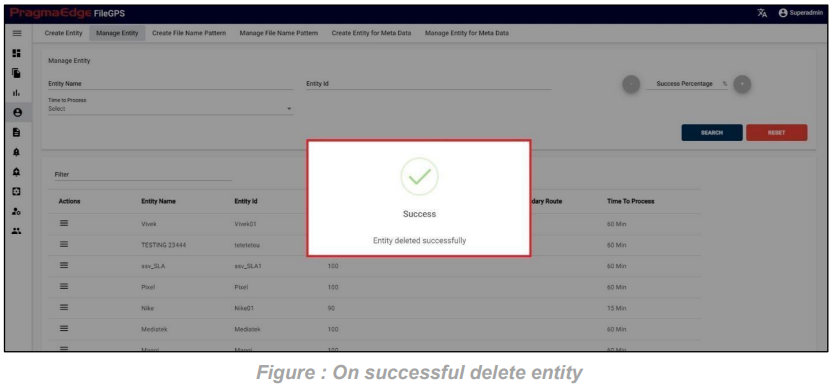
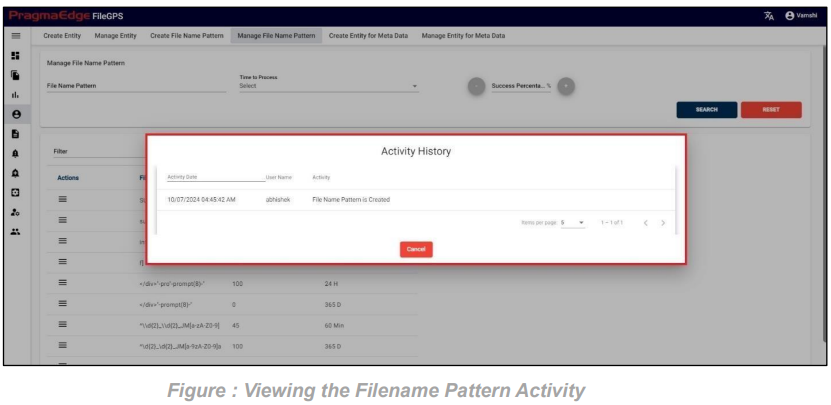
In this Manage Entity screen, Users have edit/delete/View Activity options to perform on Entity.
All the actions such as edit/delete/View Activity could be performed when user click on the particular record as shown in figure
This is the page in which the File Patterns can be created for Particular Entity
Path: Login Entity Create File Name Pattern
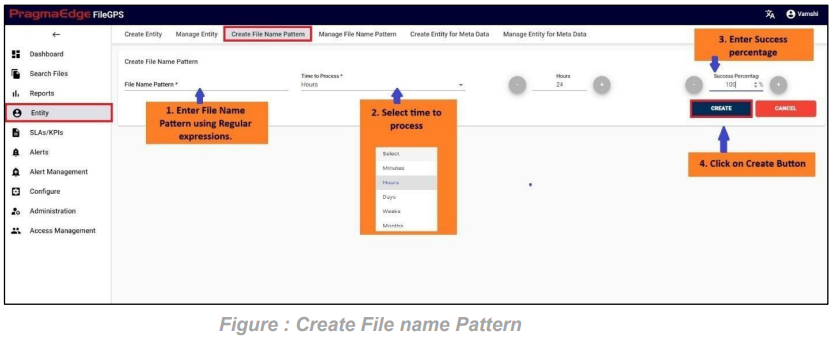
In this screen, admin can create a File Name Pattern.
Any regular expression can be created as File Name Pattern.
For example, in this scenario %ACME File Pattern details are provided in the ‘Create File Name Pattern’ as shown below Figure.
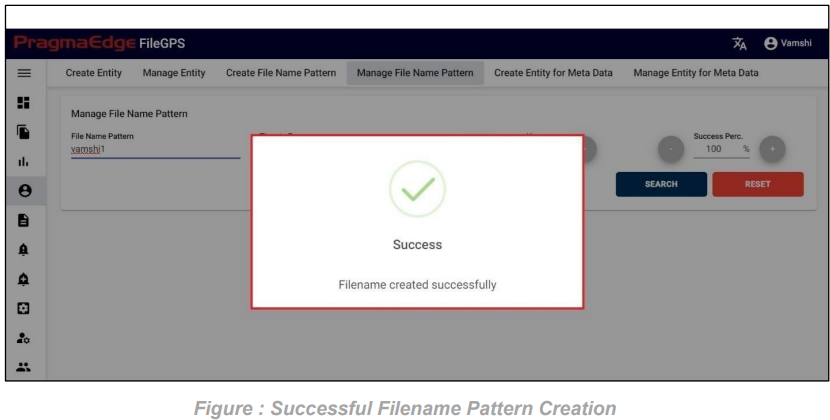
In this screen, admin can create a File Name Pattern.
In Manage Entity, User can search for the Entity based on the filters that were provided at the time of Entity creation.
Path: Login Entity Manage File Name Pattern
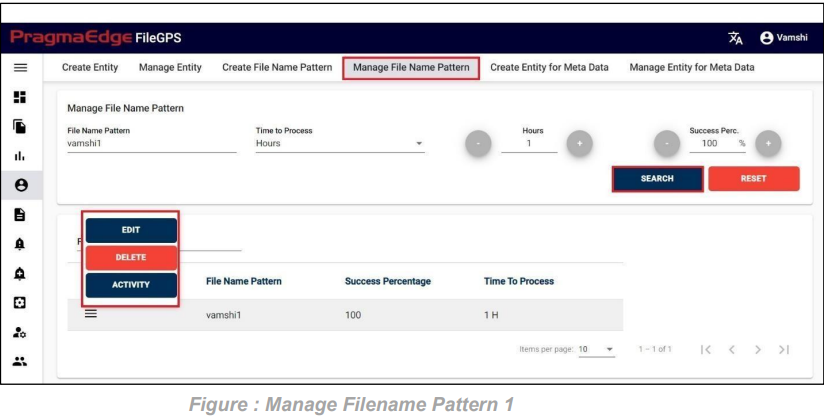
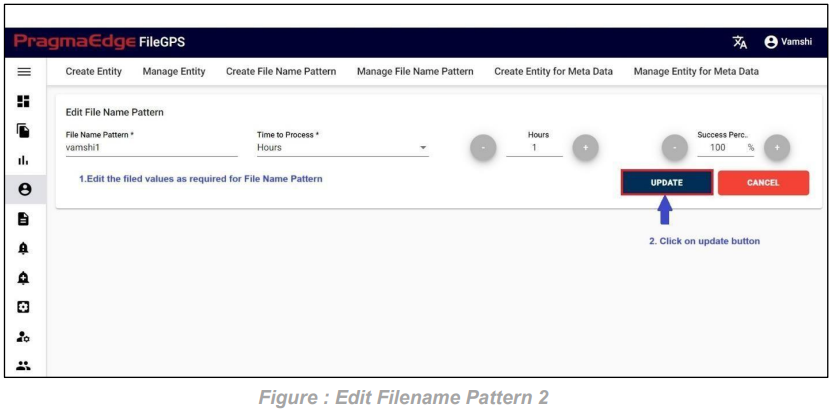
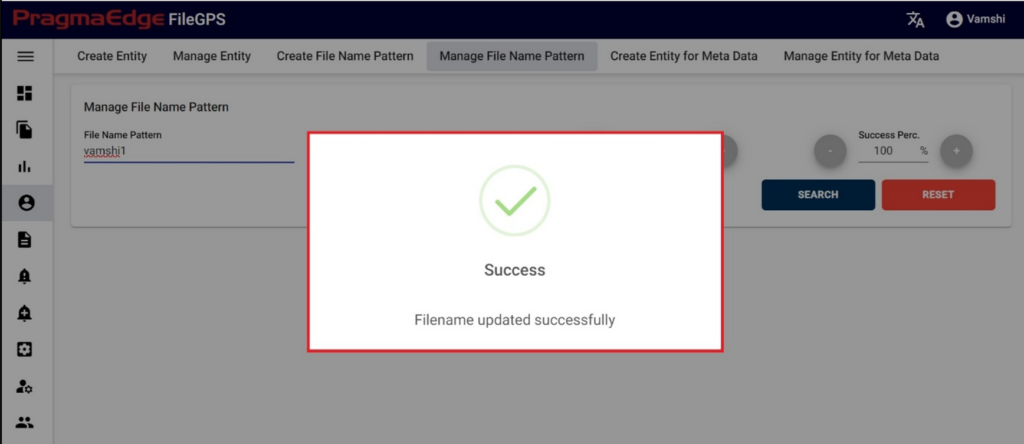
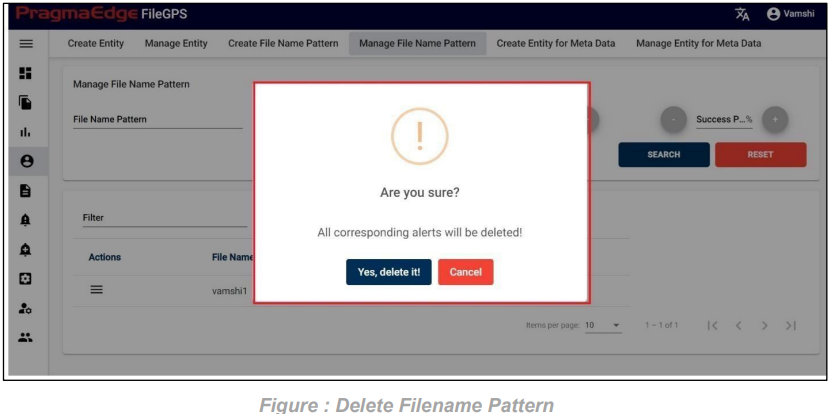
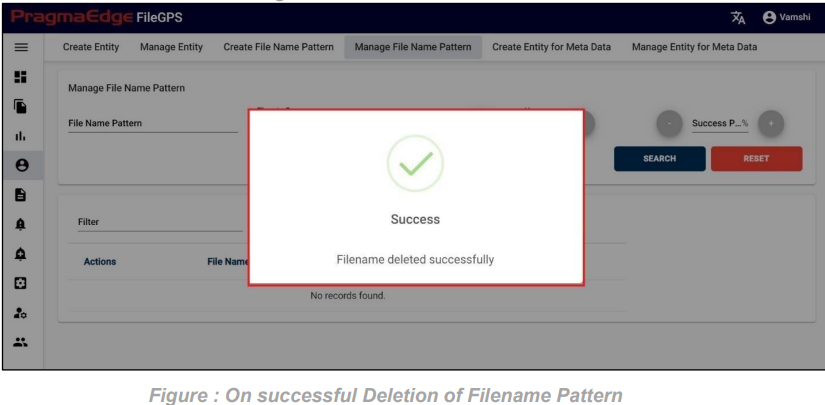
Users have edit/delete/View Activity options to perform on File Pattern.
All the actions such as edit/delete/View Activity could be performed when user click on the particular record as shown in figure.
Path:
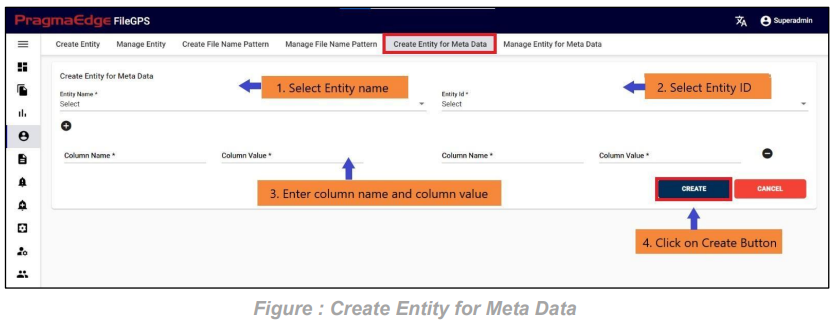
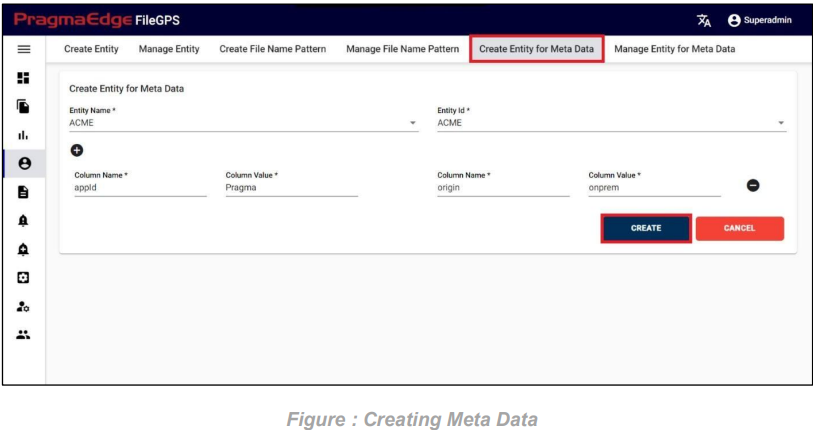
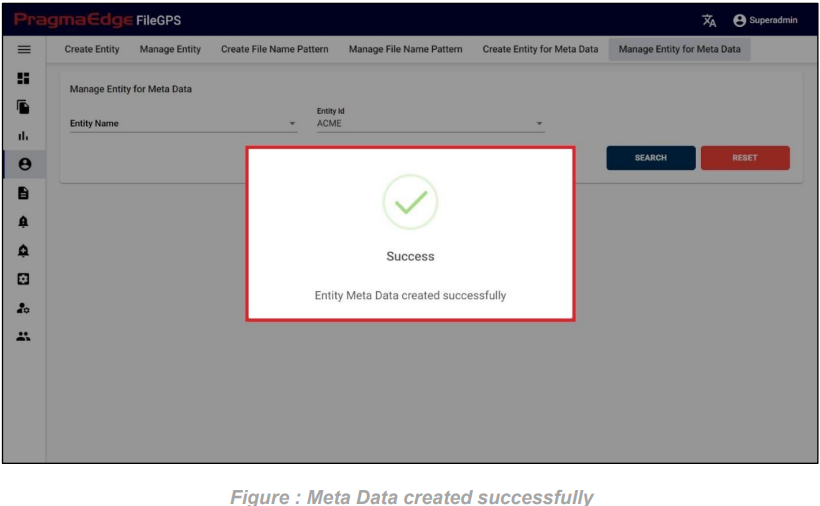
Login Entity Create Entity for Meta Data
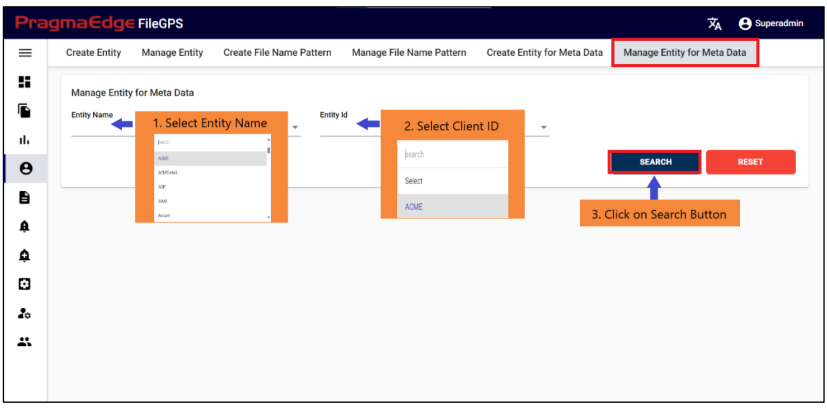
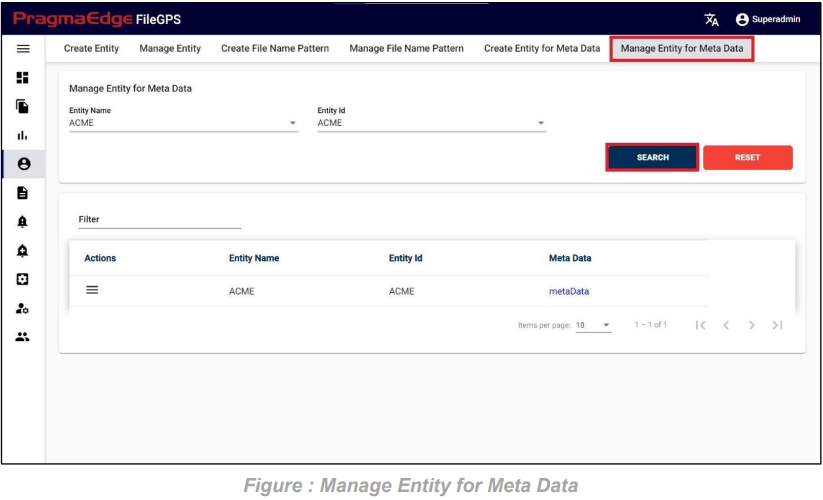
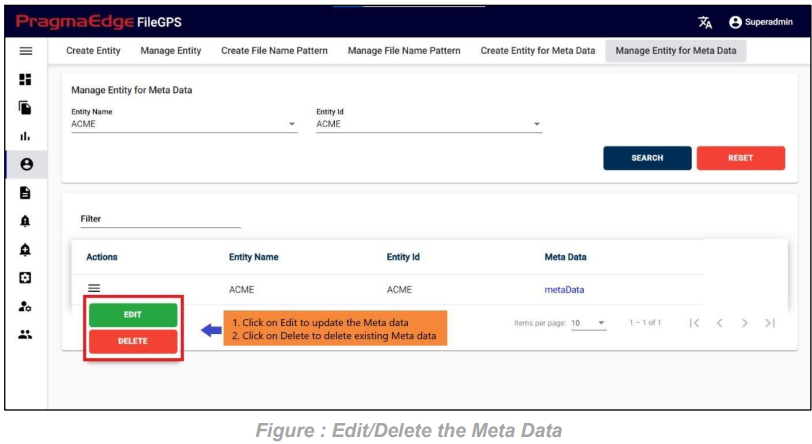
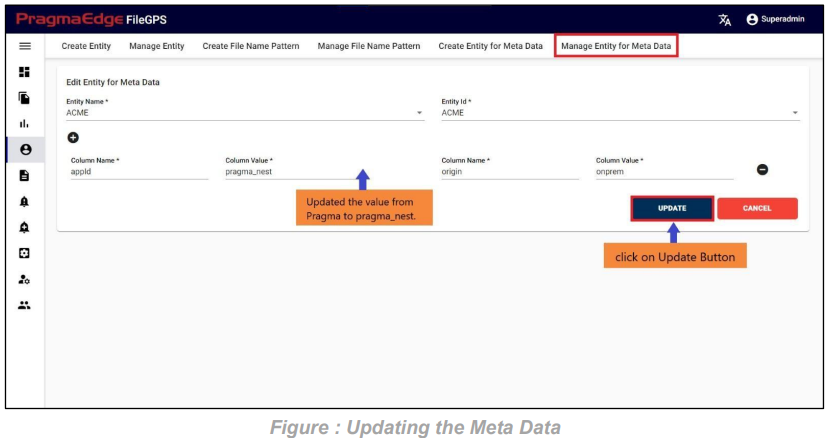
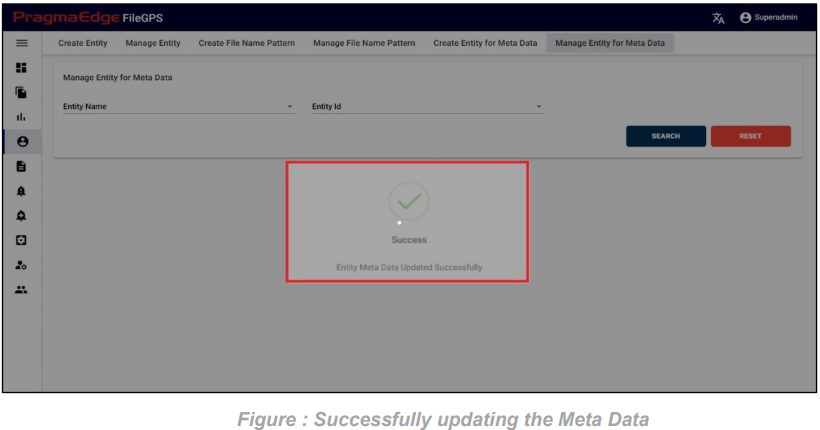
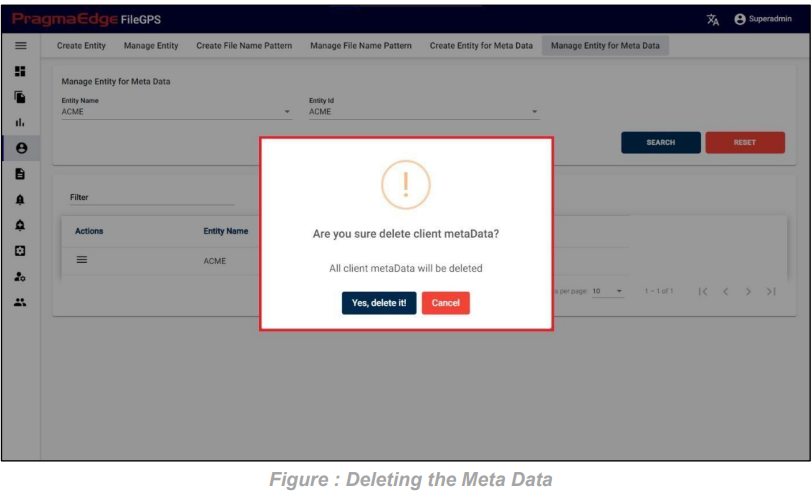
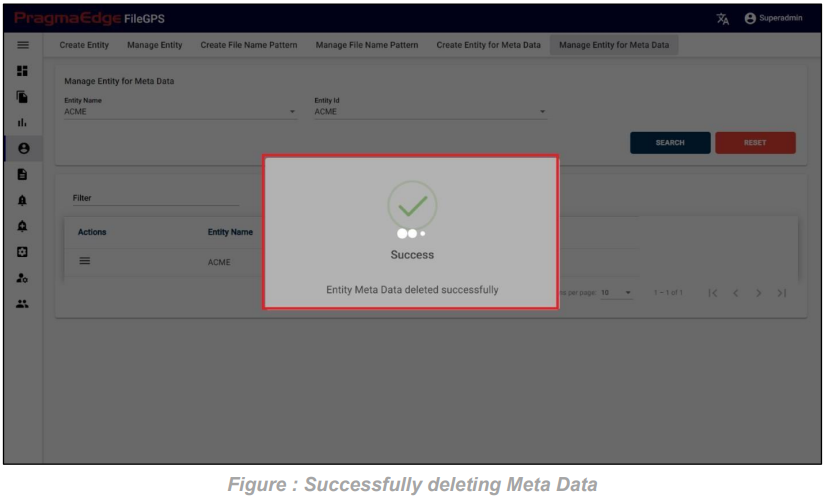
Users have the ability to create entities for metadata and oversee the management of these entities for metadata purposes.
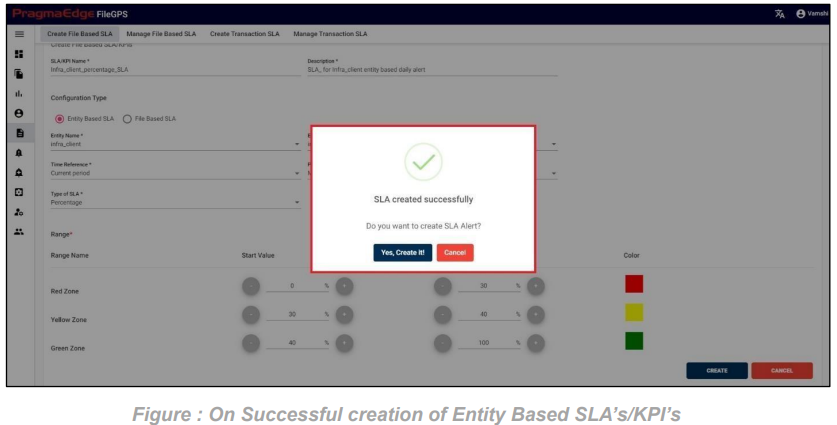
A Service Level Agreement (SLA) is a commitment between a service provider and an entity. It is also called Key Performance Indicator (KPI).
Path:
Login SLAs/KPIs Create File Based SLA
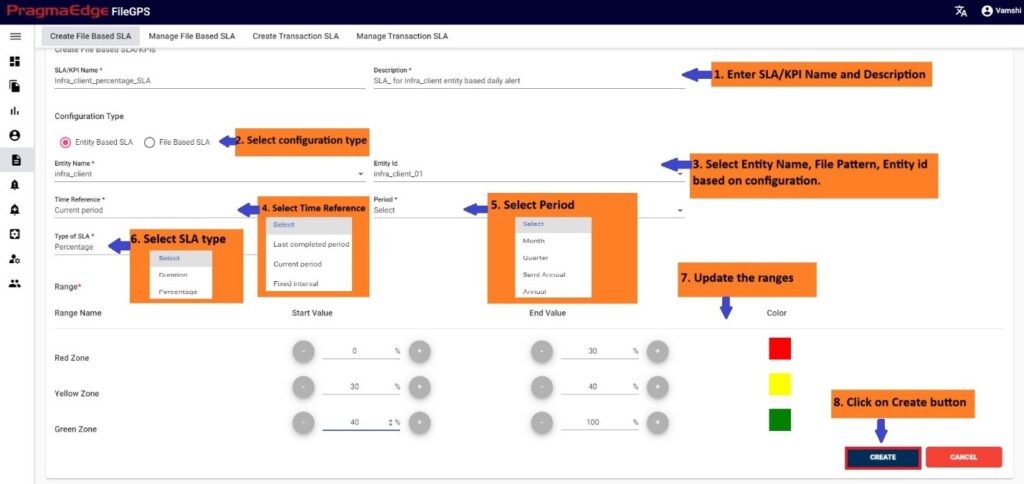
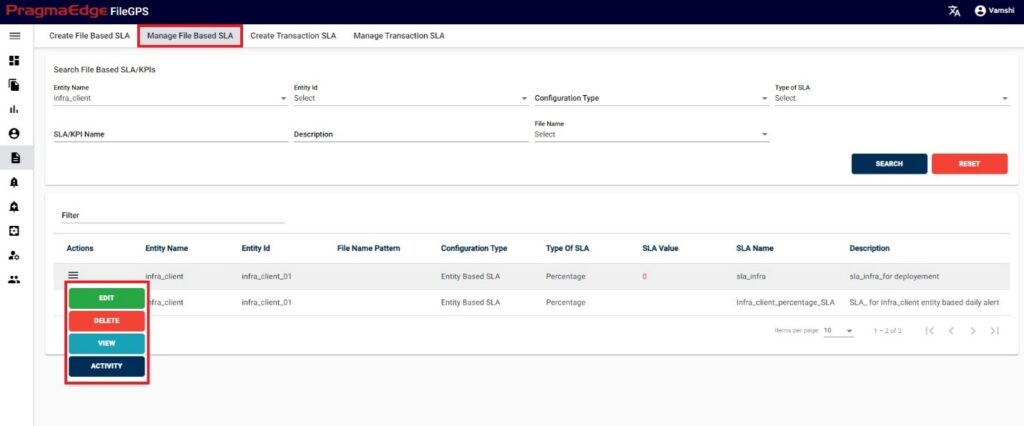
In Manage file-based SLA, User can search for the SLAs based on the filters that were provided at the time of SLA creation.
In screen of Search File Based SLA/KPI’s we can search the SLAs by providing the Entity name, Entity id, Configuration type, type of SLA and SLA name as well.
Path:
Login SLAs/KPIs Manage File Based SLA
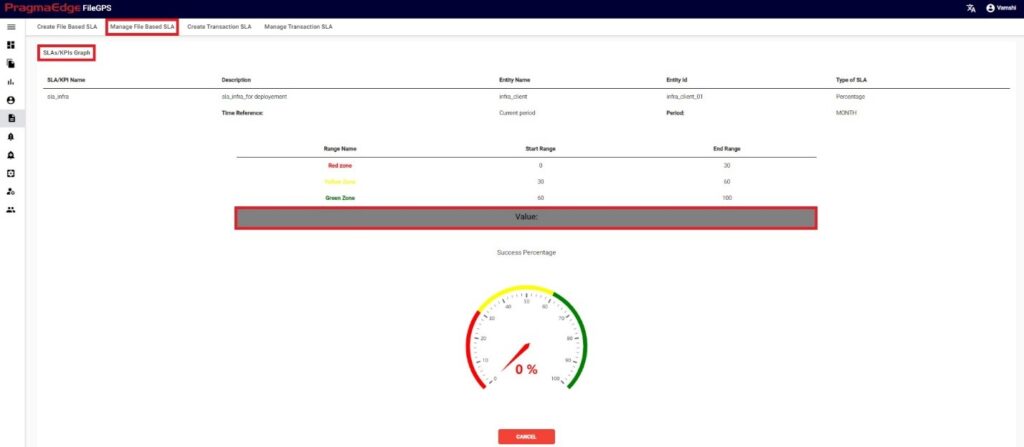
User has privilege to modify the SLA’s/KPI’s for the created entity. User has access to perform below
actions
1. Edit
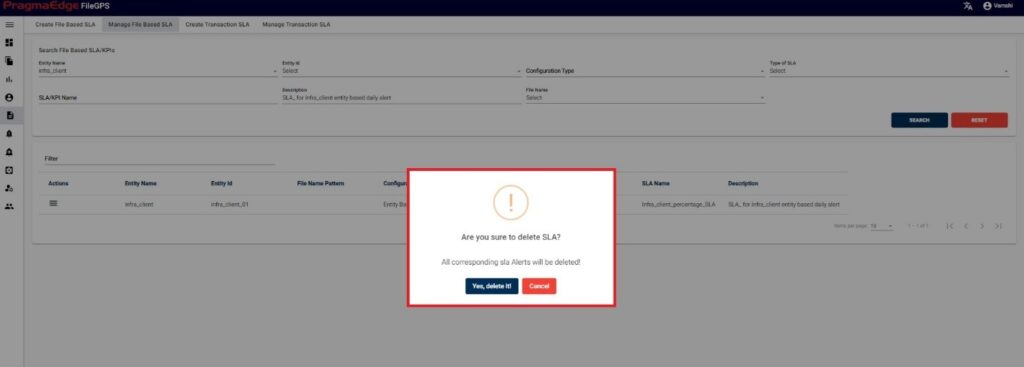
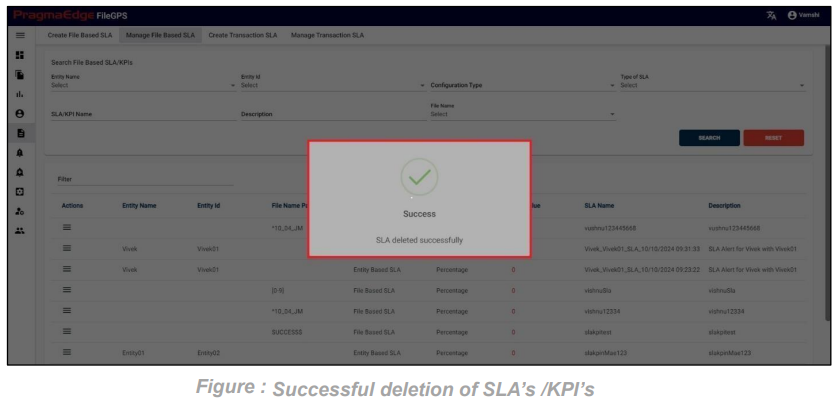
2. Delete
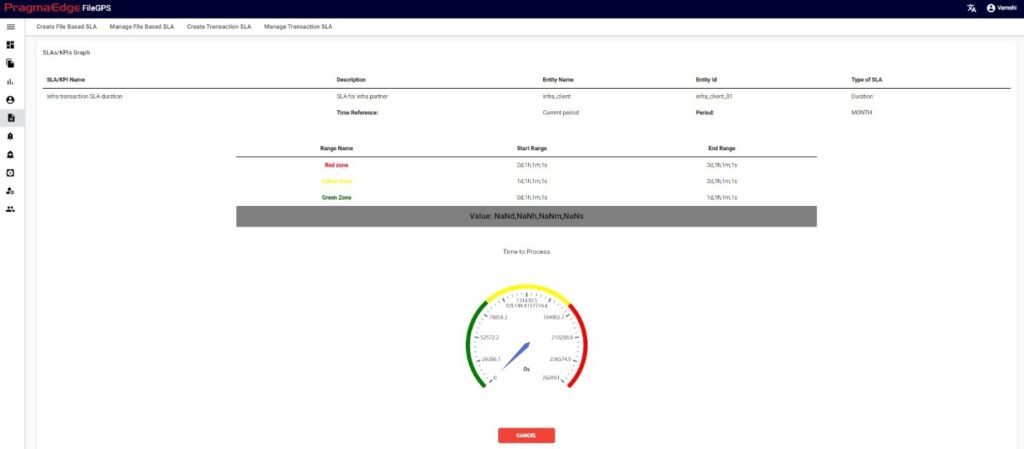
3. Graph
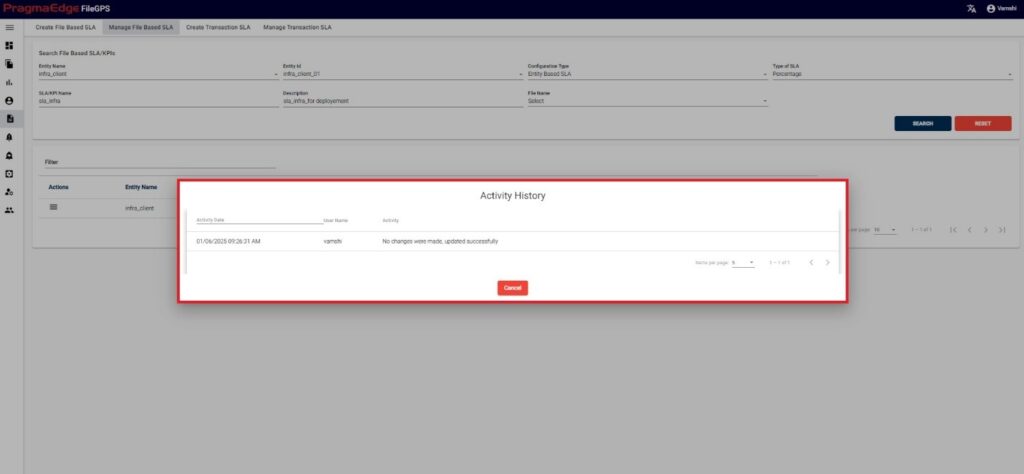
4. Activity
Path:
Login SLAs/KPIs Create Transaction SLA
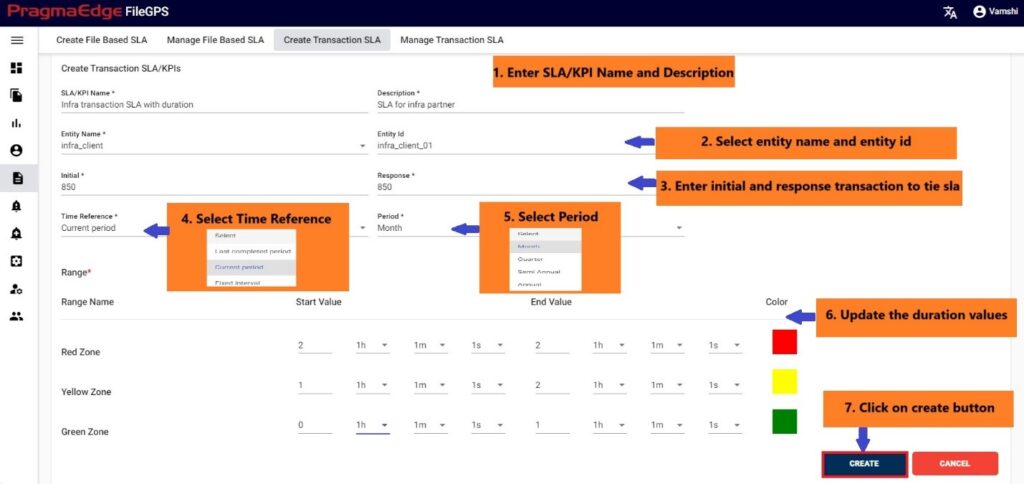
In Create Transaction SLA the user can create an SLA for Transaction files with Initial and Response transaction numbers.
Before creating the SLA alert, the user has to create an SLA for the Entity with the required processing parameters to model the condition.
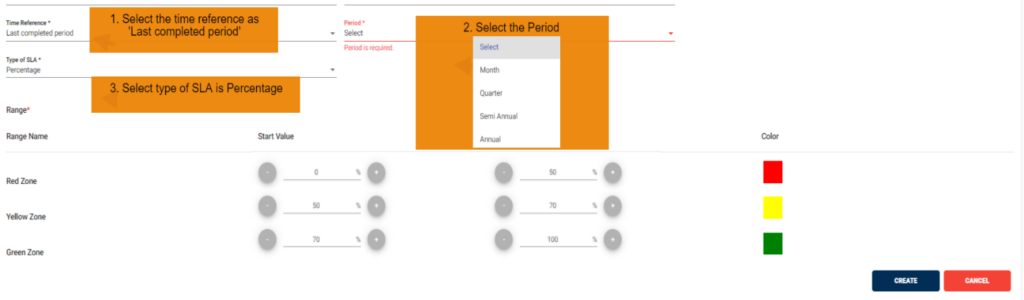
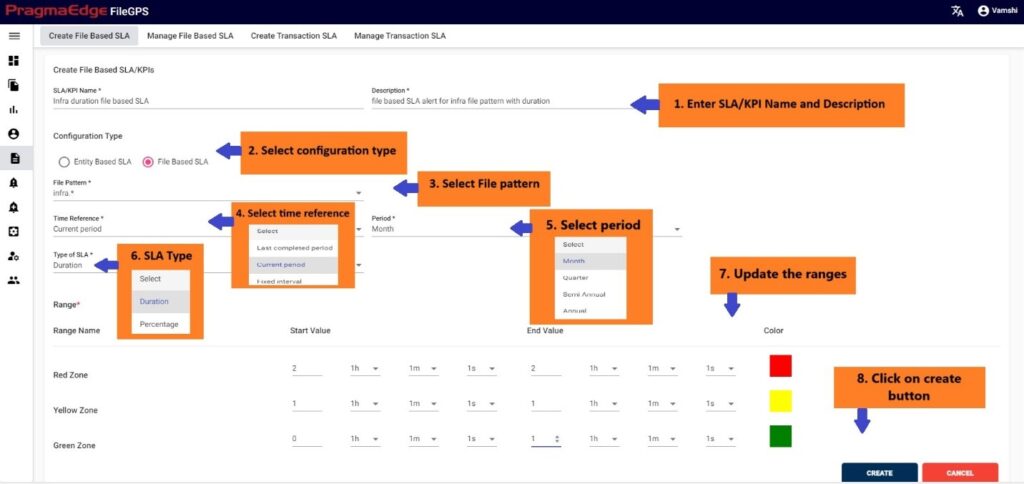
Users can Create SLAs/KPIs for the created entities, file patterns in Duration format SLA’s/KPI’s. Below is a detailed description of mandatory fields that are present in the SLA.
Time Reference:
• It is a mandatory field
• You should select any time period which is mentioned below Last completed period:
• It calculates SLA based on the files which are processed in the last completed period For example: Last completed Month (As of now: April)
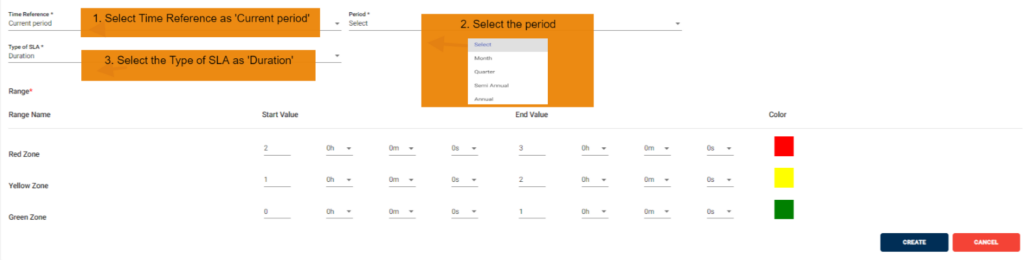
Last completed Quarter (As of now: First Quarter) Current period:
• It calculates SLA based on the files which are processed in the current period For example: Current Month (As of now: present month)
Current Quarter (As of now: present quarter)
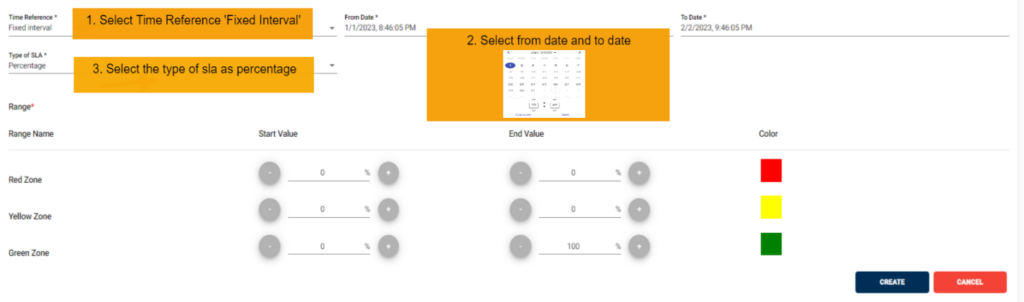
Fixed Interval:
• It calculates SLA based on the files which are processed in fixed interval
For example: From fixed Period to fixed period
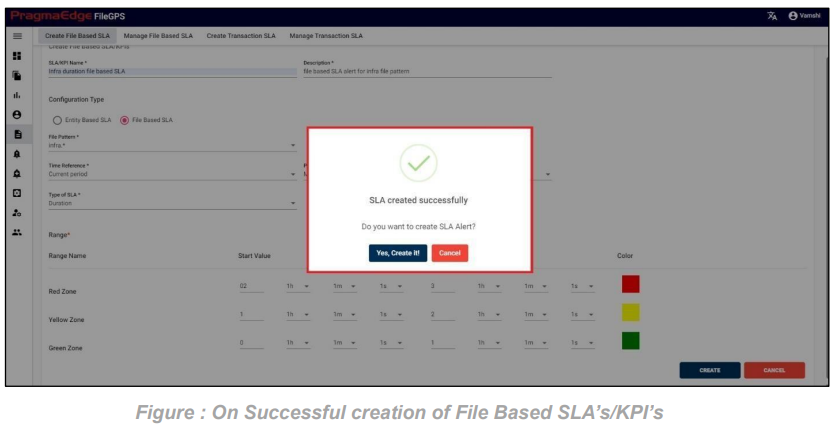
Users can create SLA/KPI’s based on the event status Duration. Here users should provide
durations to raise alerts.
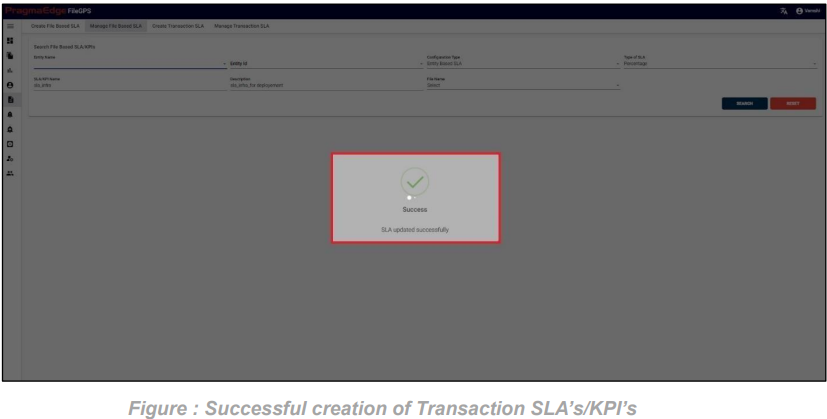
For example, in the scenario an SLA named ‘ACME Transaction SLA with duration’ is created as shown below Figure
In the SLA details please enter the SLA name and description. Here Select the entity name and entity id. And enter the initial and response transaction numbers to tie the SLA. In the Time reference details please enter the time when we are expecting this SLA to tie the files in the time range provided. We have provided a detailed explanation regarding these after the alert created with heading ‘Time reference of SLA in detail’.
In type of SLA, we have percentage and duration values to calculate SLA value. Where percentage will be in integer values and duration will be in time range values. Please fill the ranges accordingly.
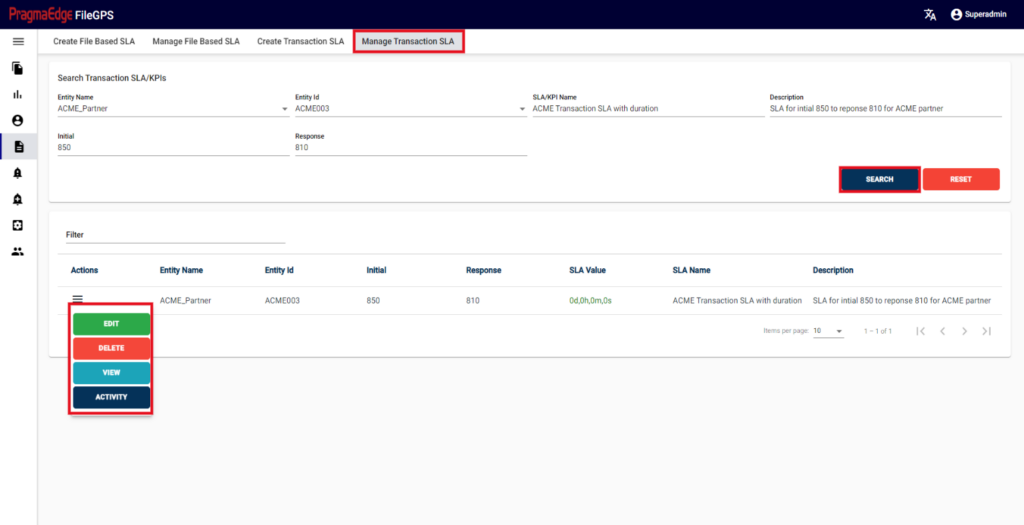
In Manage Transaction SLA, User can search for the SLAs based on the filters that were provided at the time of SLA creation.
Path:
Login SLAs/KPIs Manage Transaction SLA
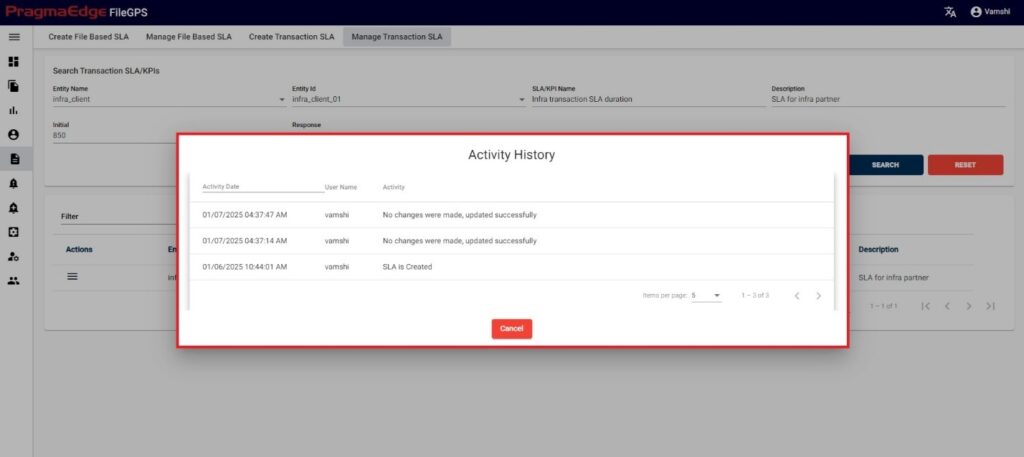
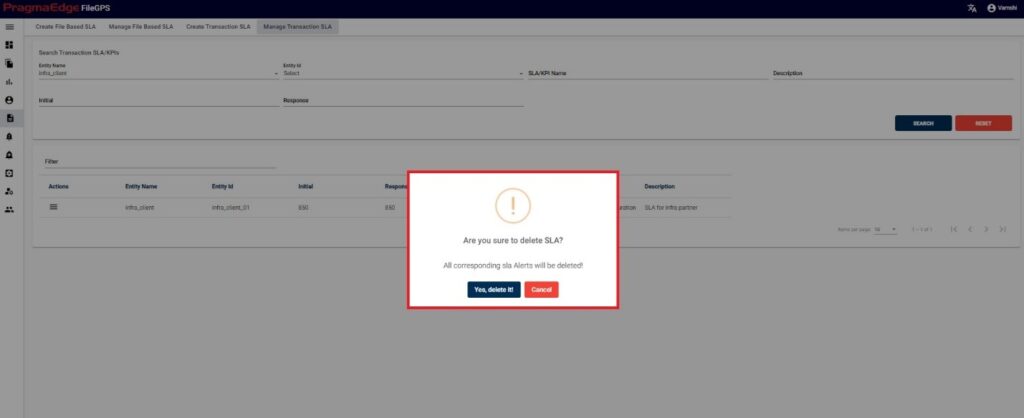
User has privilege to modify the SLA’s/KPI’s for the created entity. User has access to perform below actions
1.Edit
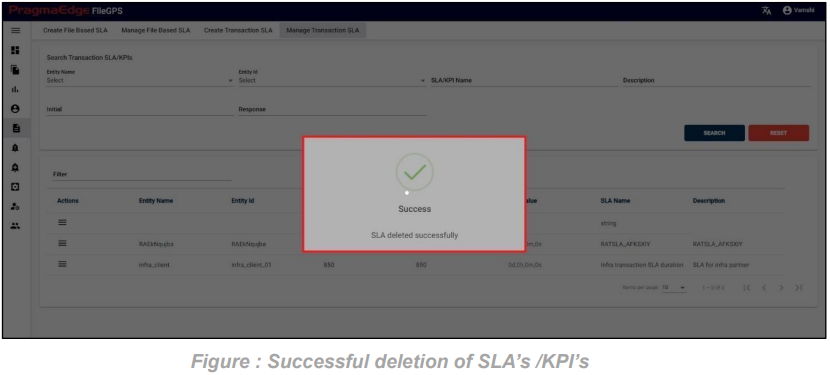
2.Delete
3.View
4.Activity
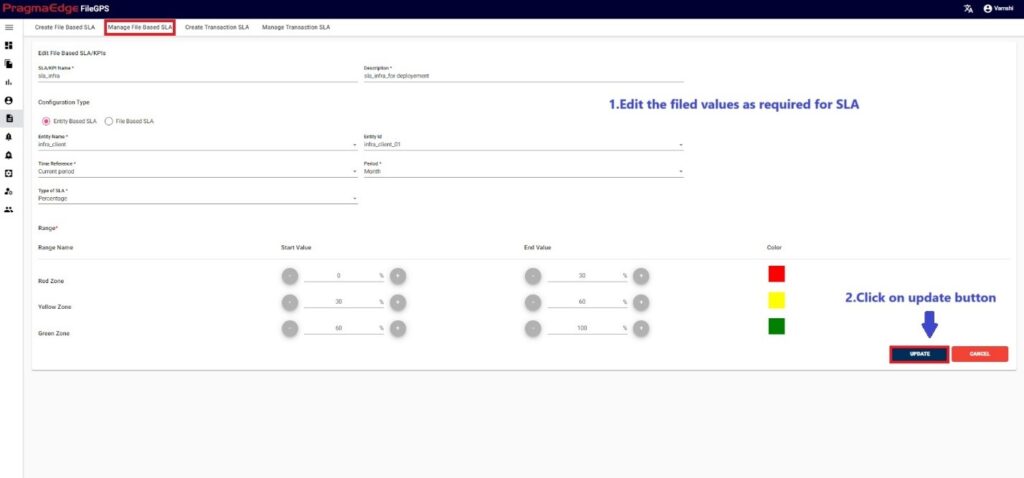
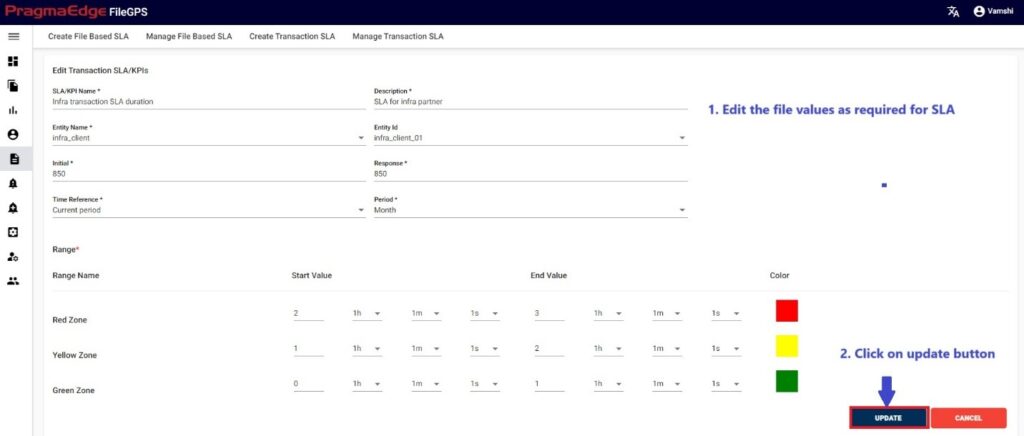
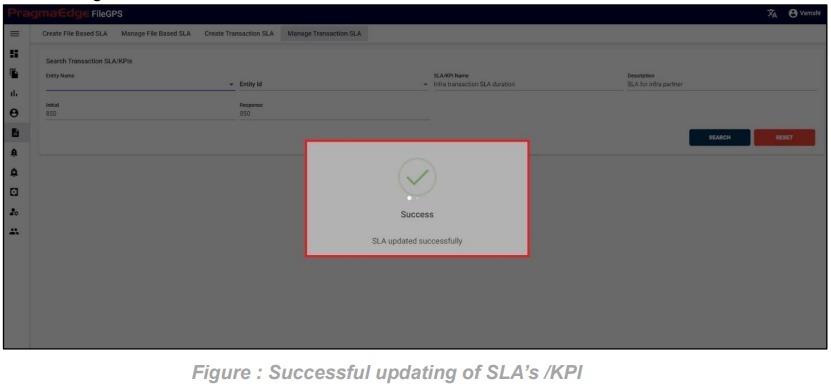
‘EDIT’ option is used to edit the SLA details. By clicking on the edit option, the page will be navigated to create a page module where we can change details as per requirement.
Alerts option notify the users in the dashboard when alerts match the condition configured by the user.
Path:
Login Alerts
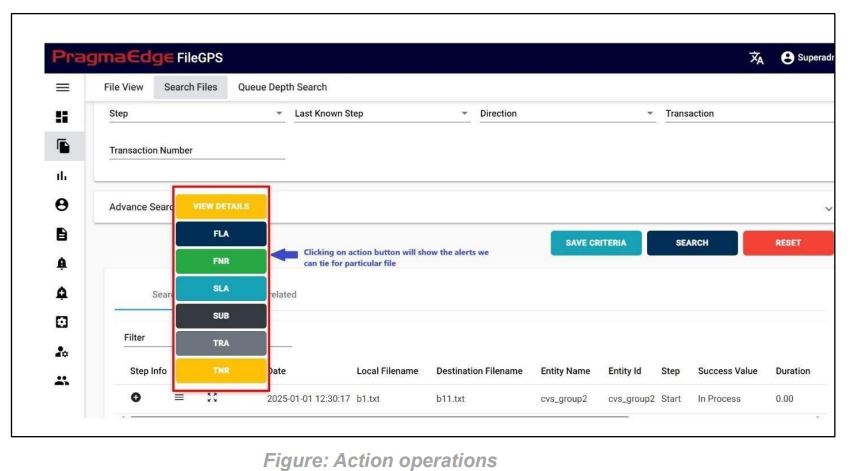
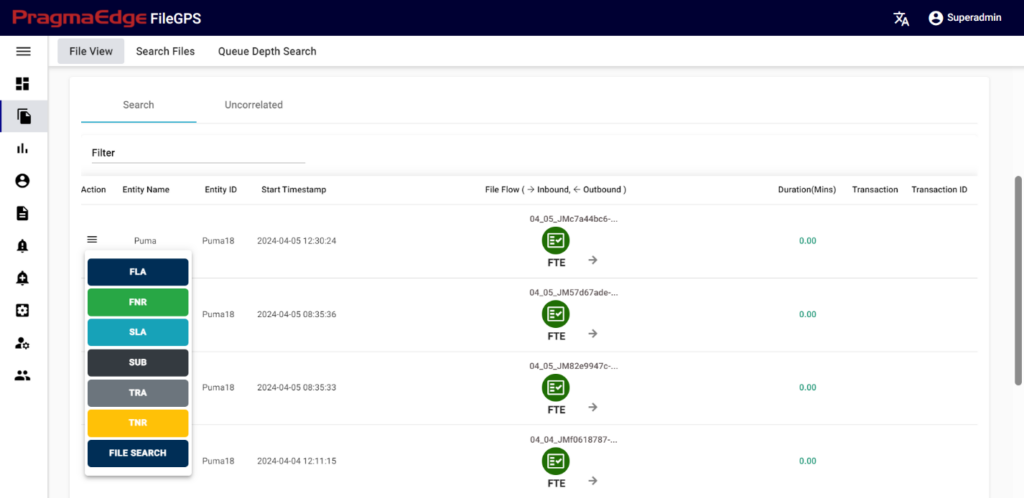
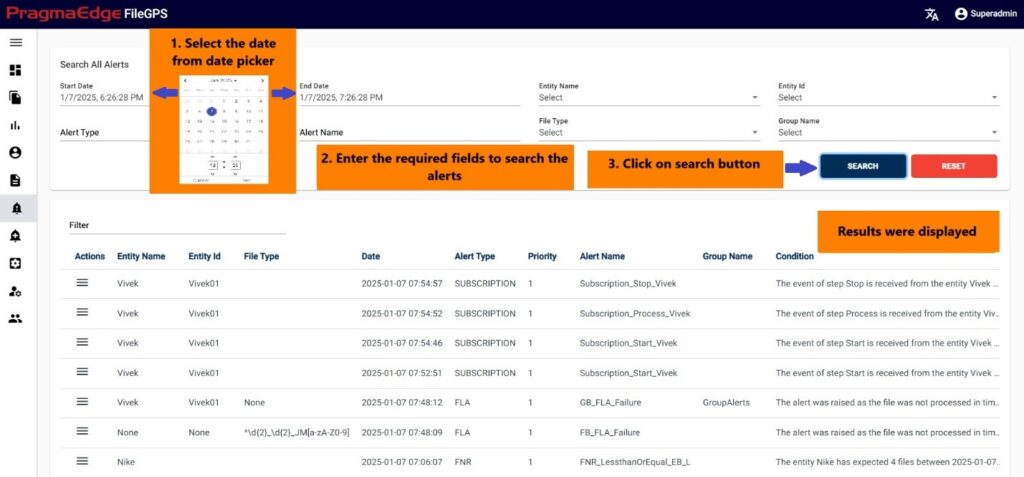
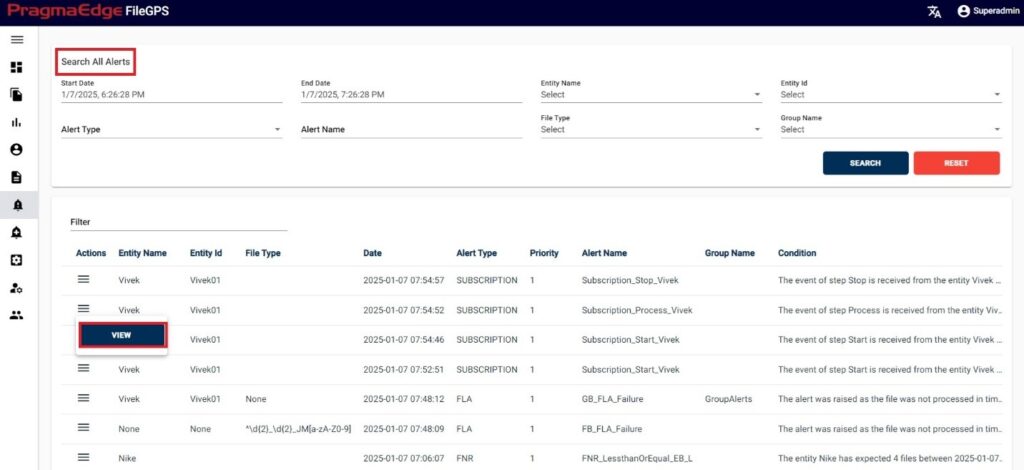
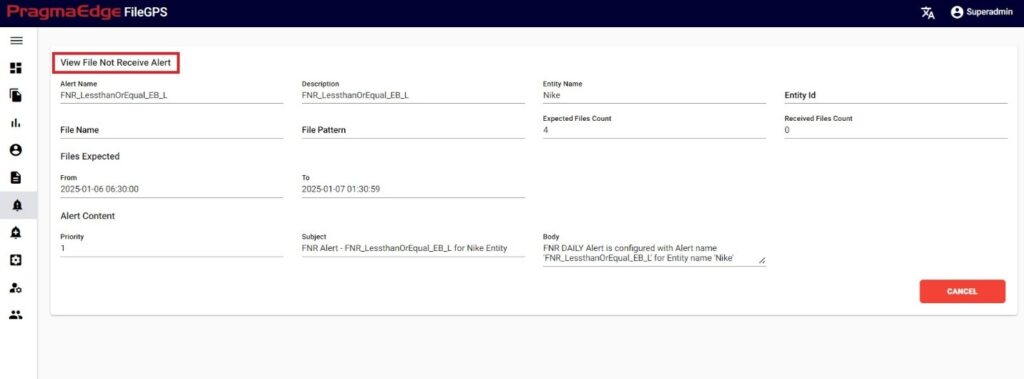
Users can search for the list of alerts that were generated based on the selected criteria. In the below scenario various application alerts such as SLA Alerts, FNR Alerts, Subscription Alerts, TNA Alerts, TRA Alerts, QDA Alerts and FLA Alerts that were raised are shown in the figure below.
Users can search the alerts that matched the condition notified in this module just by giving the fields provided like data range, entity details, alert type and alert details. After providing the details just click on the search button. The raised alerts will be displayed as shown in the figure below.
In Alert Management, the user can configure the alerts based on his requirement and manage the alerts.
Path:
Login Alert Management
Users can create and manage alerts to track the transmissions of the files to a particular hub. Alerts are categorized into multiple subcategories
1. Manage
2. SLA
3. FNR
4. FLA
5. TNR
6. TRA
7. QDA
8. Subscription
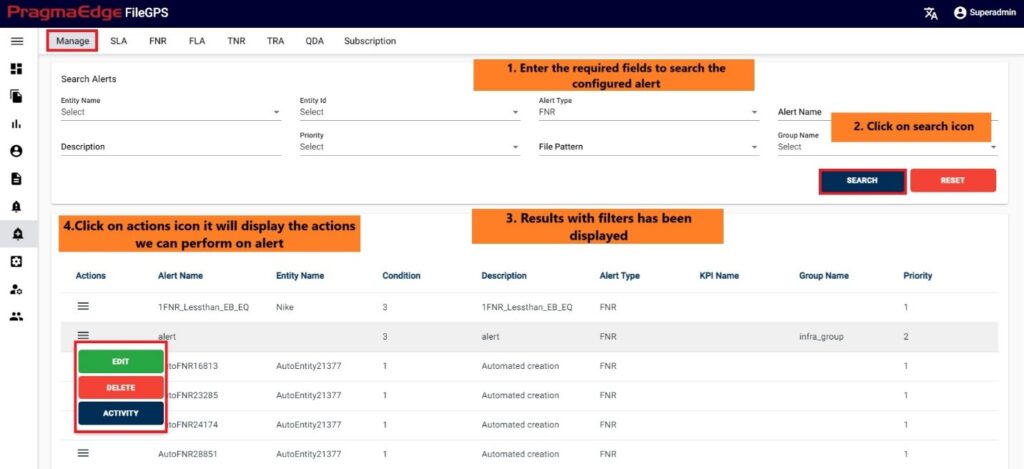
In Manage Alert, User can search for the Alerts based on the filters that were provided at the time of Alerts creation. By searching with the filtered columns, the results will be displayed with alerts.
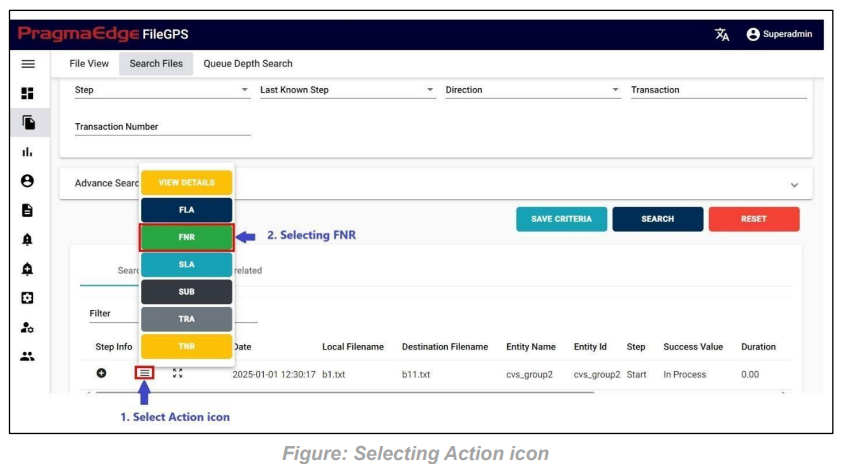
We will have an action icon on the left side of the record where we can manage a resultant alert.
Path:
Login Alert Management Manage
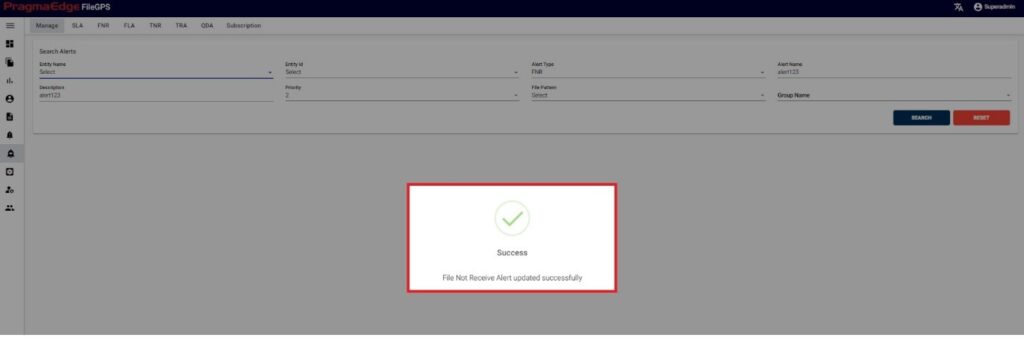
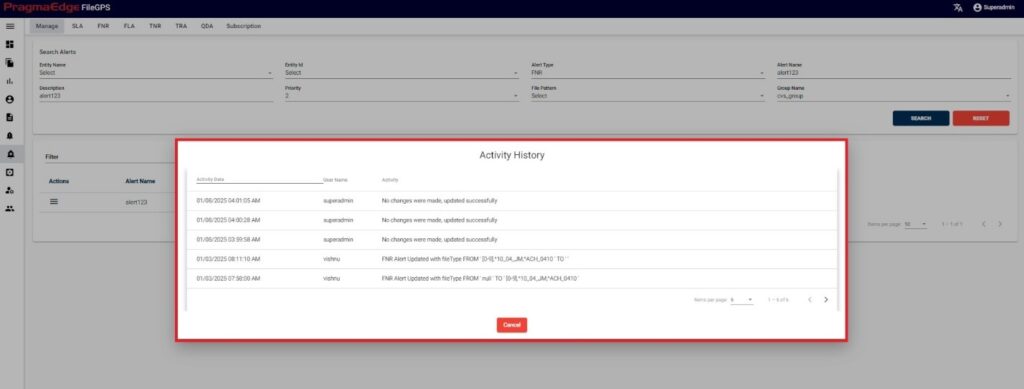
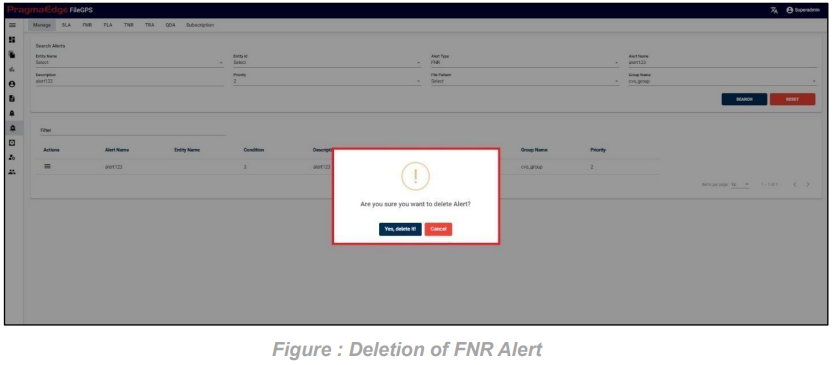
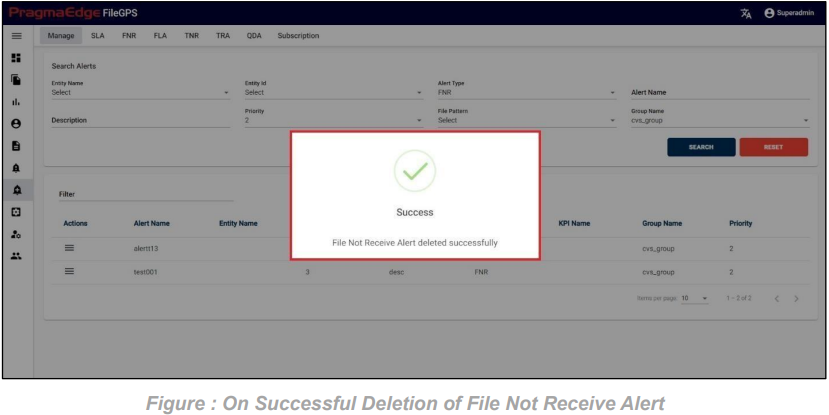
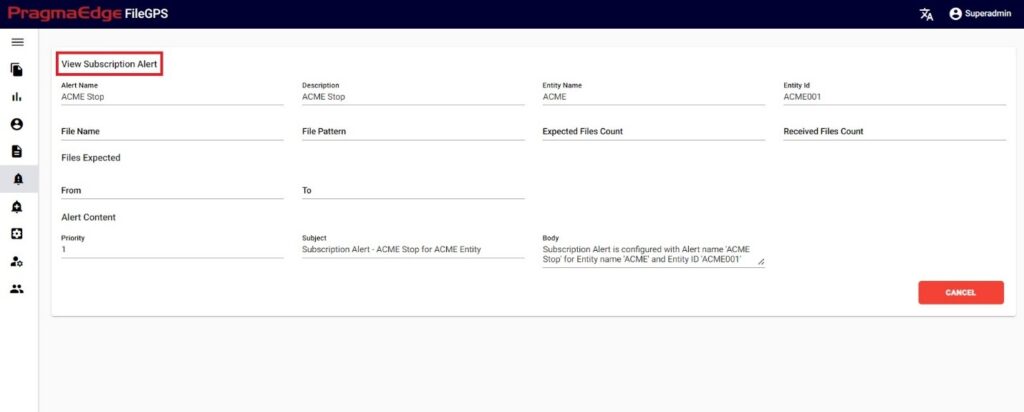
Users have edit/delete/activity options to perform on alerts.
All the actions such as edit/delete/activity could be performed when user click on the action icon of the record as shown in figure below.
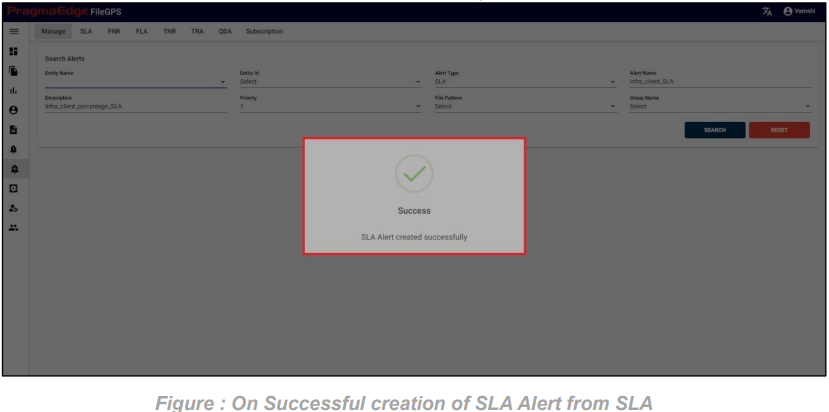
Service Level Agreement Alert can be configured by the user based on the requirement of the time ranges and percentages.
SLA’s can be tied to the files by configuring SLA in SLA/KPI module and tie alert to it to raise notification when SLA is breached. Here in this module, we are going to tie SLA Alert for the SLA created.
Path:
Login Alert Management SLA Alert
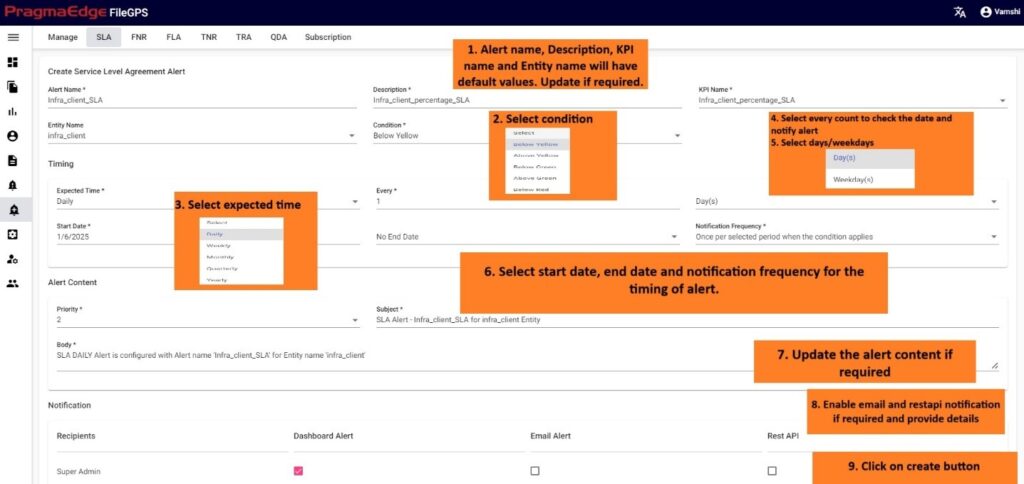
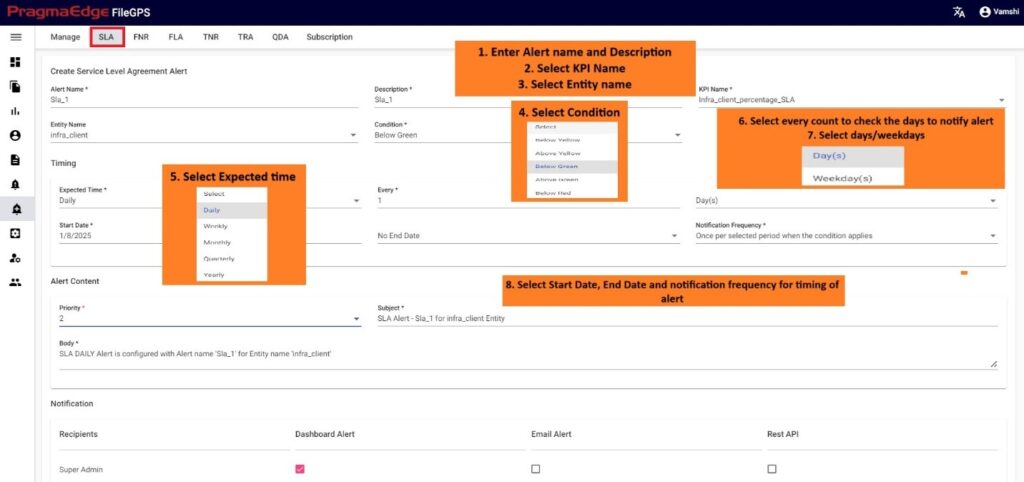
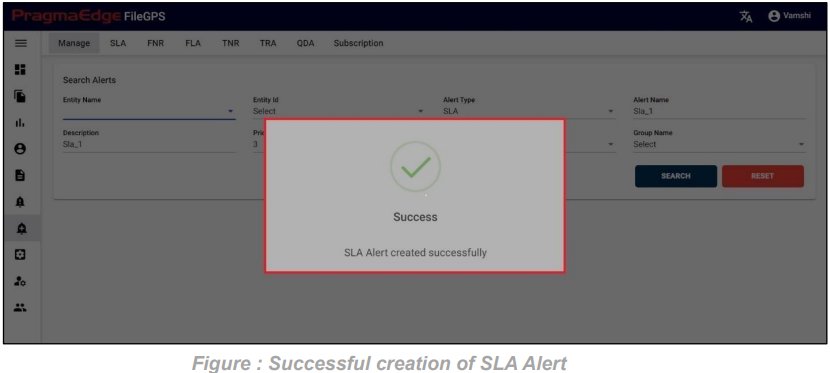
In SLA Alert tab, user can create SLA alert for required Entity or files by committing conditions according to the time ranges and percentages predefined in SLA.
The pre-requisite in order to configure the Alert is, corresponding SLA should be created. For example, in below scenario Figure, user has configured the SLA Alert by giving alert name as ‘Daily SLA Alert for ACME Entity Yellow Zone’ condition based on percentage to the SLA named ‘ACME SLA Percentage’. and entity as ACME Partner.
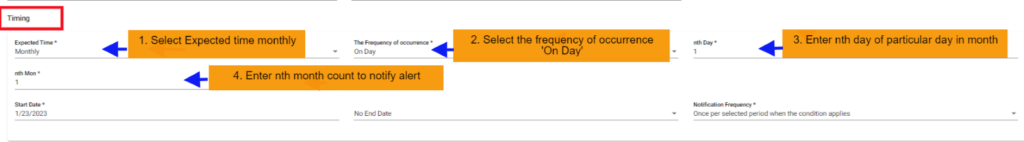
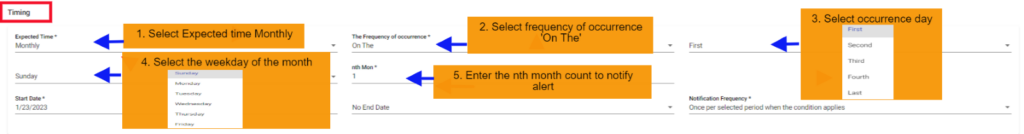
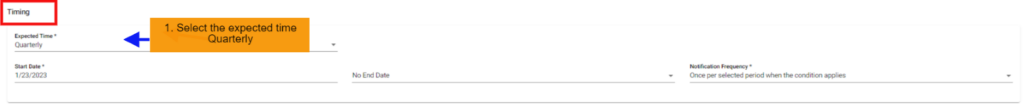
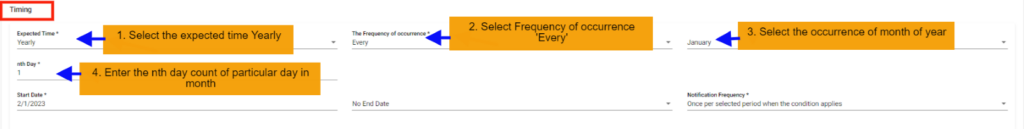
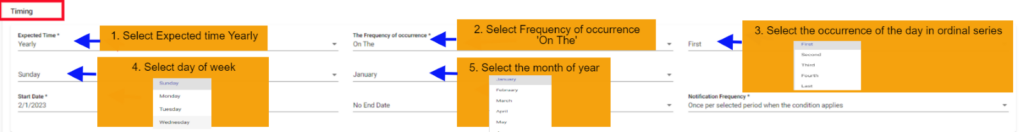
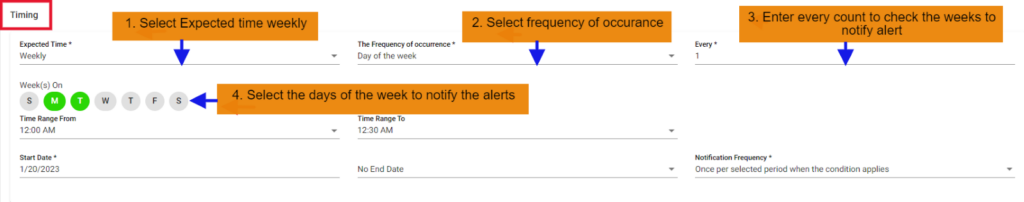
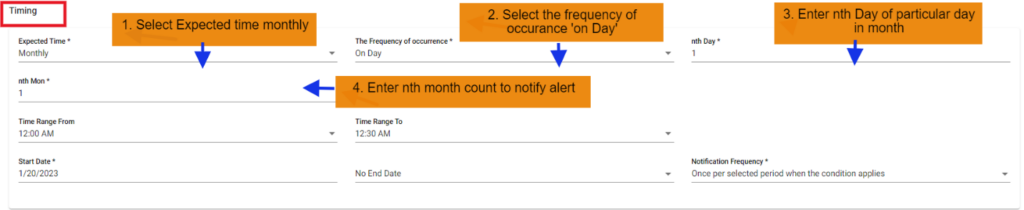
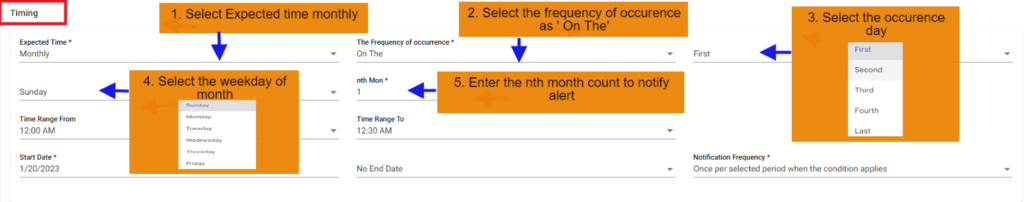
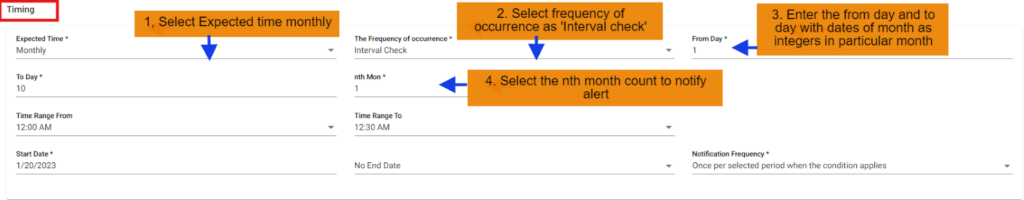
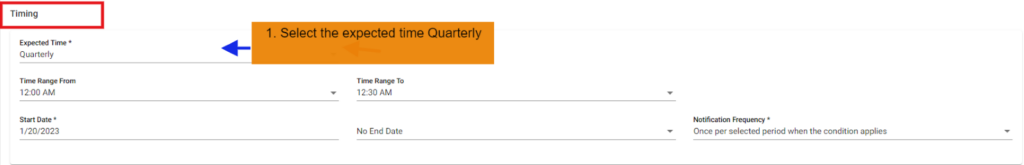
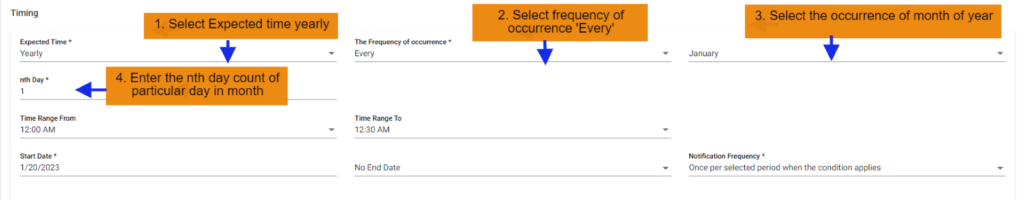
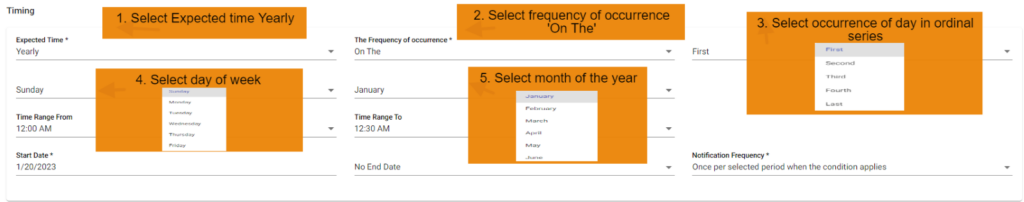
In the Alert details please enter the alert name, description and select SLA name we need to tie this alert and entity name as well. Similarly enter condition of SLA to check the SLA value is in which condition so that if it matched with configured it will raise the alert. In the Timing details please enter the expected time when we are expecting this alert to be notified as we have provided options like daily, weekly, monthly, quarterly, and yearly details. We have provided a detailed explanation regarding these after the alert created with heading ‘Timing of SLA Alert in detail’.


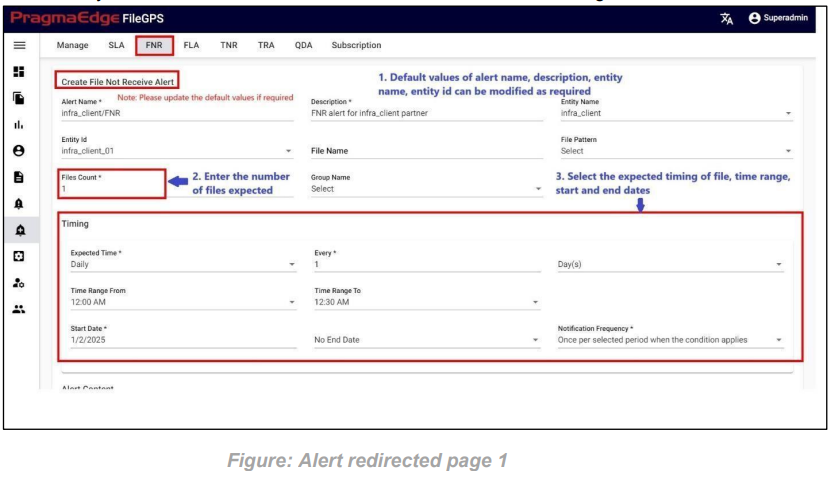
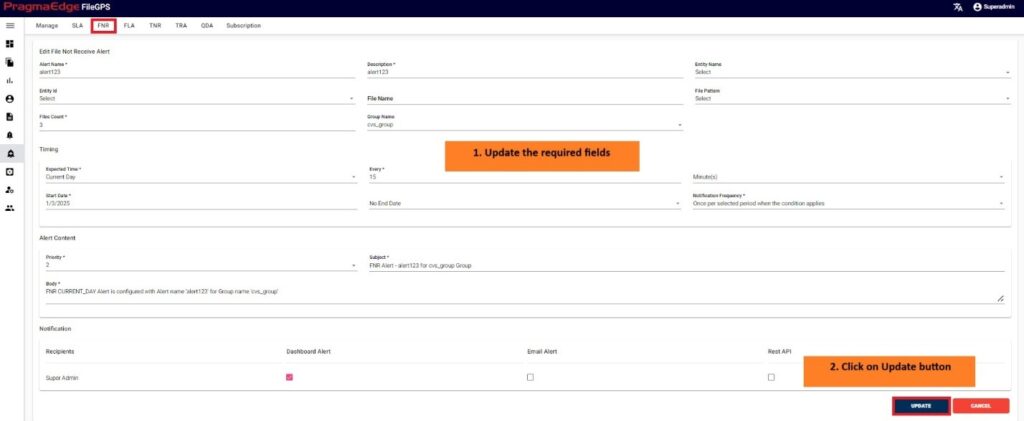
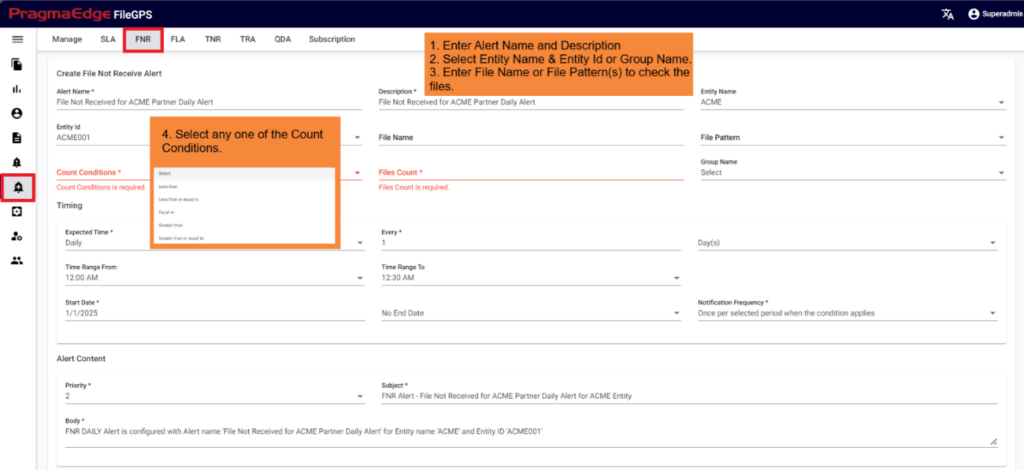
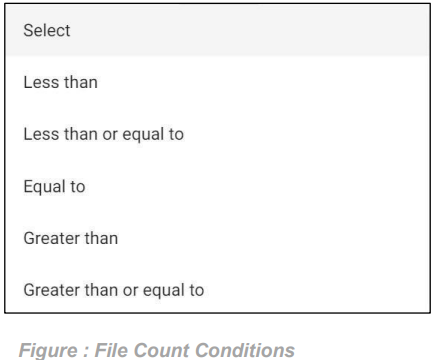
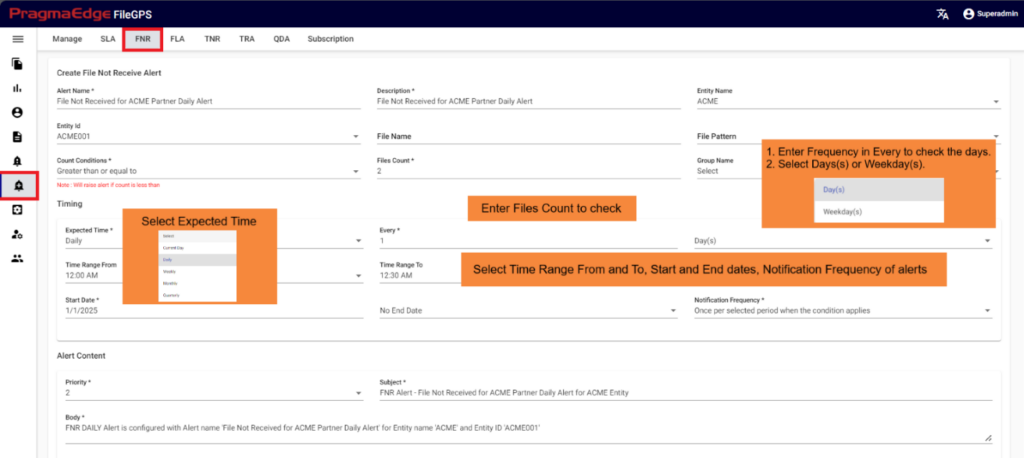
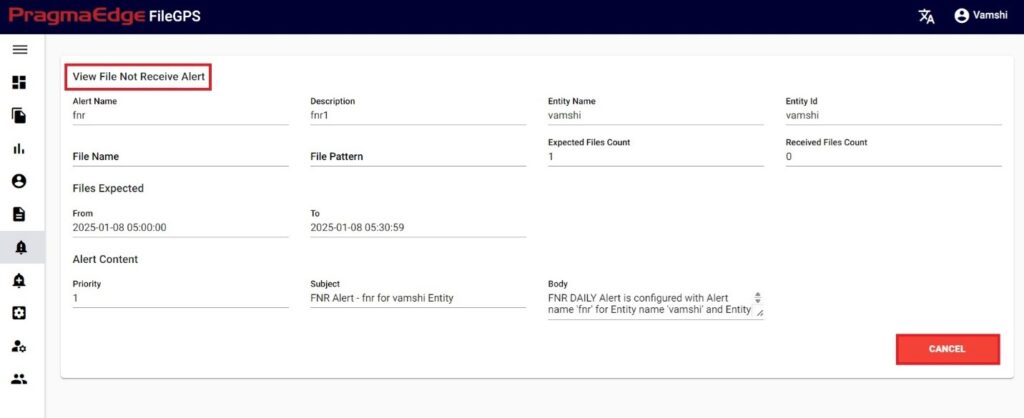
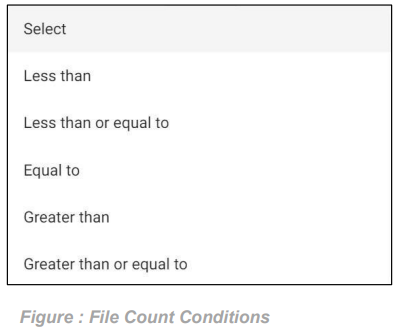
In the File Transfer process, if the file has not reached its destination, in other words, if the event state start was not found then ‘FNR’ alert will be raised. This alert lets the business team know that the file has not been received for the entity or group of entities. File not Received alert will notify the user if the configured expected files count does not match with received file count for the particular entity. We can configure the file count while creating alert as shown below.
Path:
Login Alert Management FNR
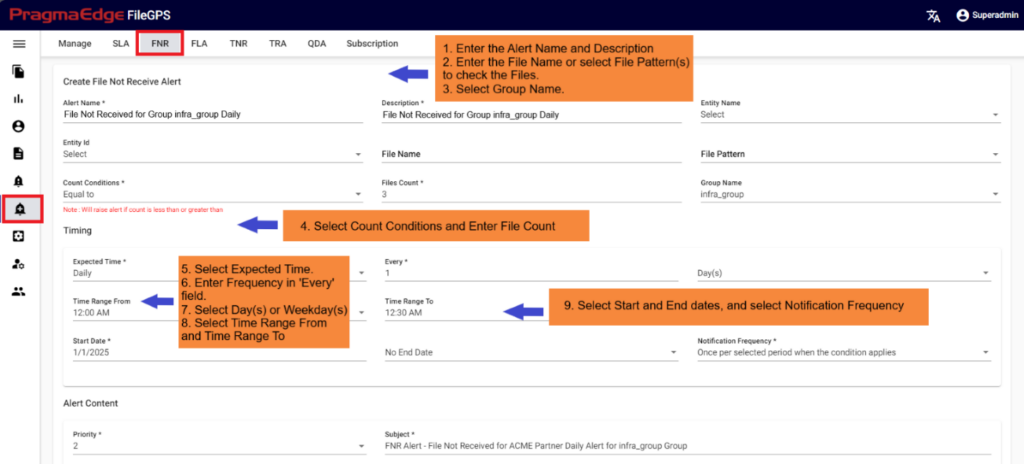
We have two scenarios for configuring FNR alerts: one is FNR for entities, and the other is FNR for groups.
FNR Alert for Entity:
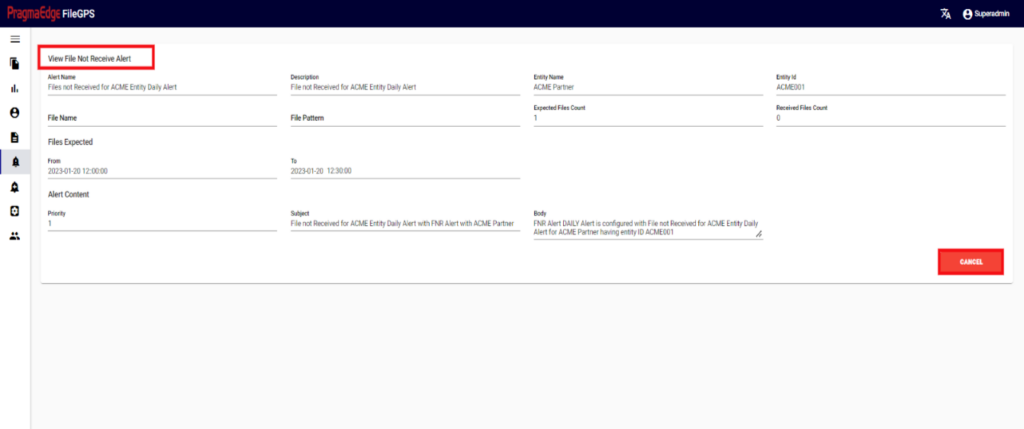
In the below figure user has configured the FNR Alert for Entity by giving alert name as ‘Files Not Received for ACME Entity Daily Alert’ and entity as ACME Partner, Entity Id as ACME001. In the Alert details please enter the alert name, description, select entity name and entity id as well. Enter the filename if we know the exact file name to match while checking the files. Similarly, enter the file pattern or multiple file patterns if there are patterns to match the files. And please enter the files count of the files to match with the received files count condition.

File load alert is raised whenever a file is processed from one node to other, file load alert will raise with success status if the file is transmitted in the prescribed time. Else File load alert is raised with failure status. In either of the cases the file load alert notifies the user on the file transmission.
For Every entity and File pattern we will be configuring ‘time to process’ value while creating it. If the files for the prescribed entity or entities in a group or file pattern, load or received within the time to process, then it’s a success condition. Similarly, if a file fails to load then it is in failure condition. This File load alert will track the success and failure condition for each file while transmitting from one node to another node and raises the notification.
Path:
Login Alert Management FLA
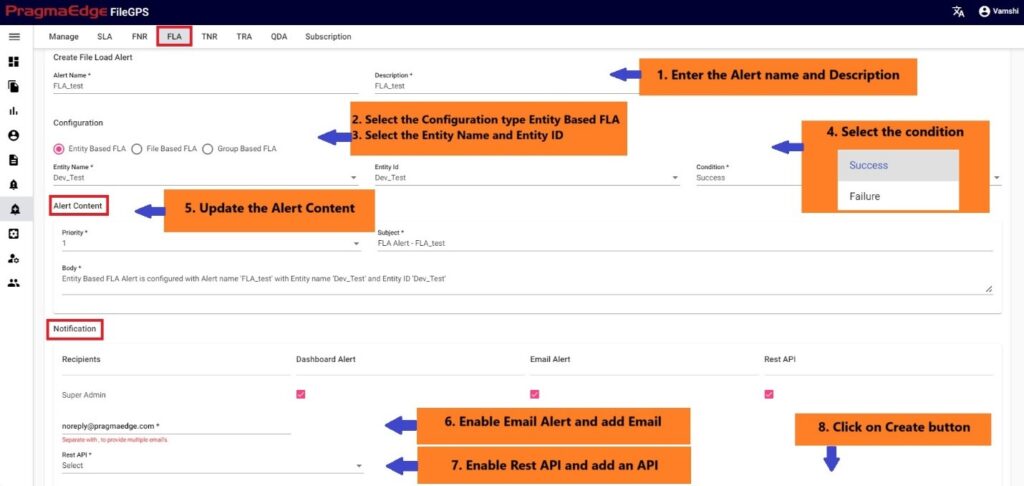
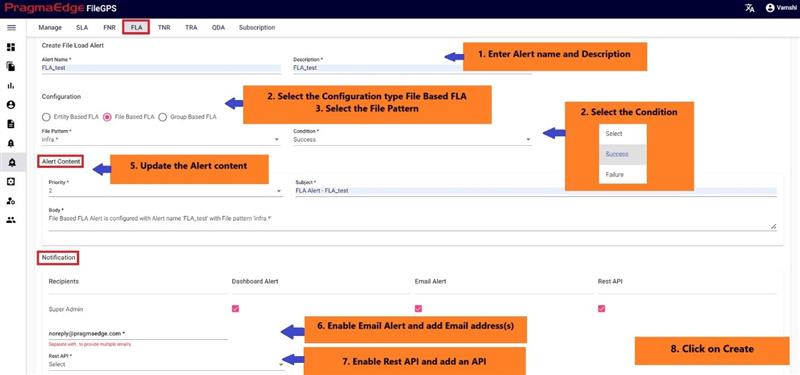
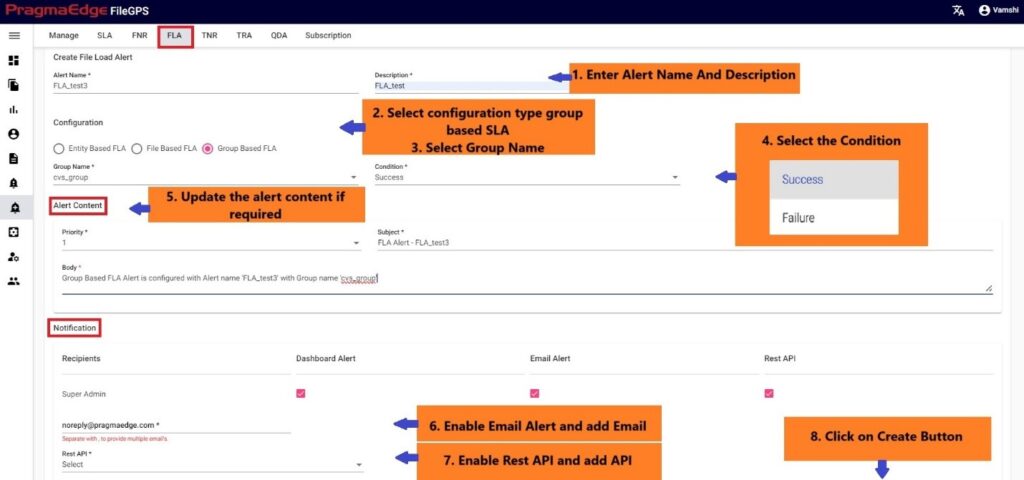
File load alert can be configured for Entity based, file pattern based, and Group based.
Creation of Entity based FLA:
In the below figure, user has configured the File Load Alert by giving alert name as ‘ACME Entity File Load Success Alert’ for the ACME Entity.
In the Alert details please enter the alert name, description and select the configuration type entity based and select entity name and entity id. Similarly, select the condition of the FLA to check for the file.
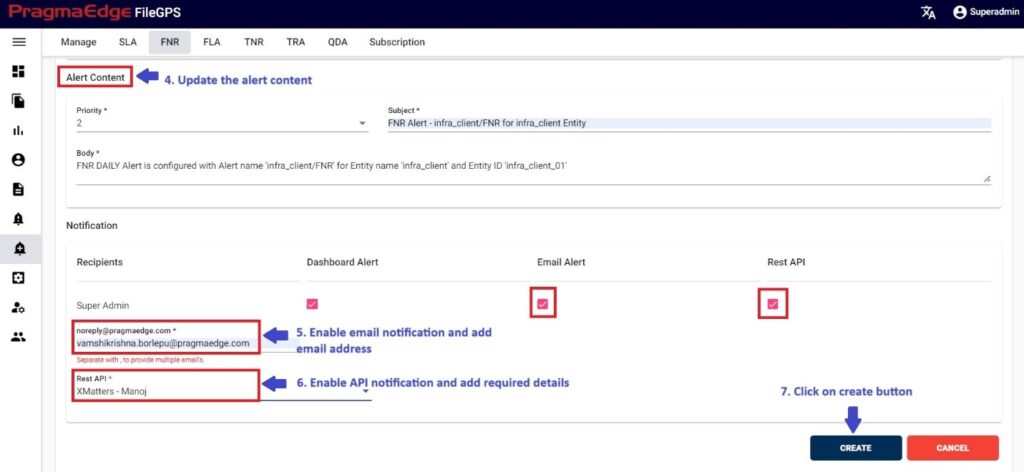
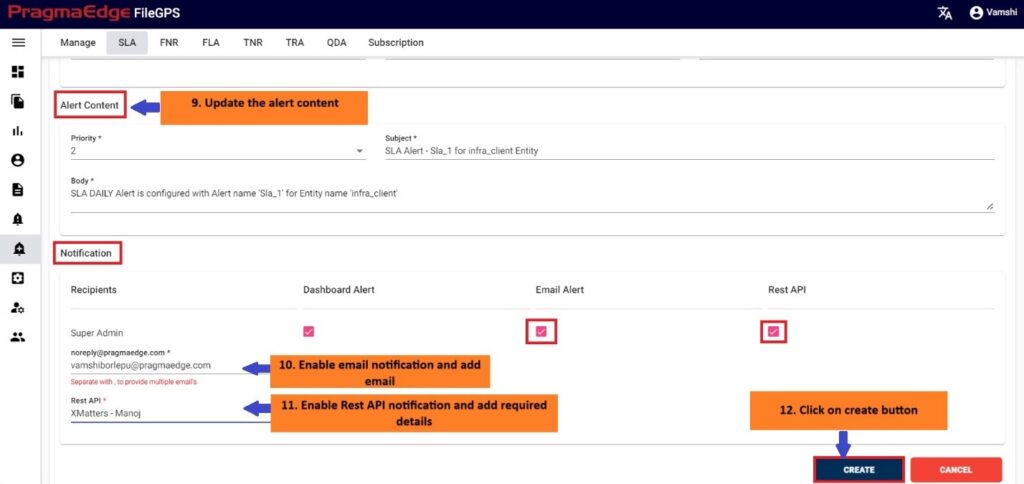
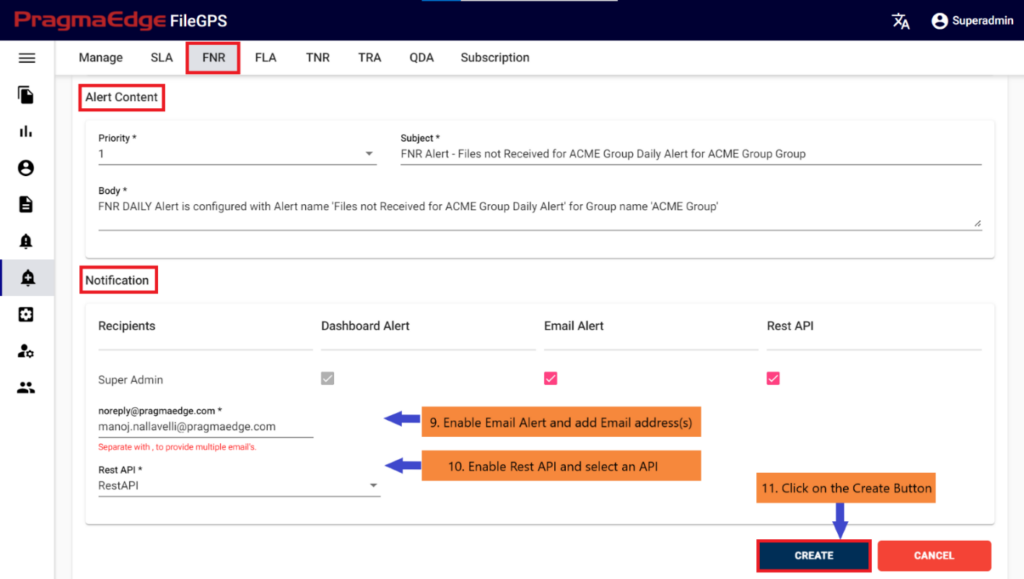
Update the alert content details by providing the priority of the alert to be in alerts modules, subject and body will be default added with some selected alert information. Update it if required.
In notifications details dashboard alert notification is default selected for every alert and please enable the other notifications email and rest API by providing the details required as shown in below figure. If we enable the email notification, please provide an email address. Similarly, if we select the Rest API notification, please select the API from the drop down.
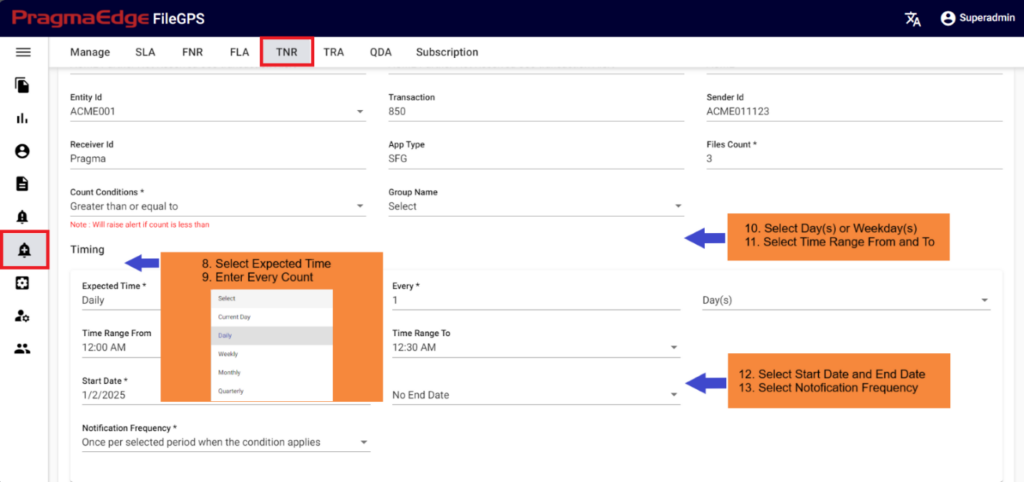
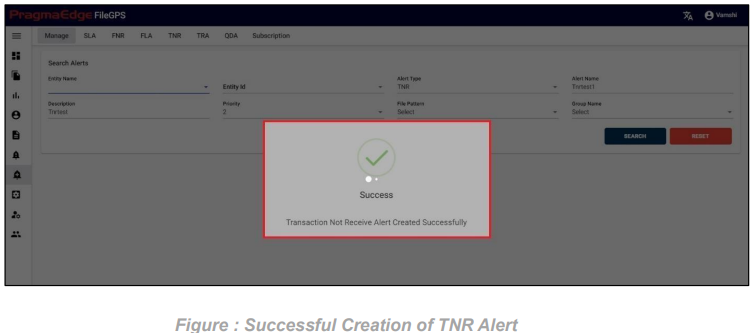
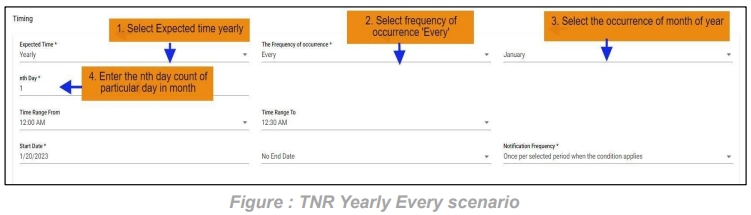
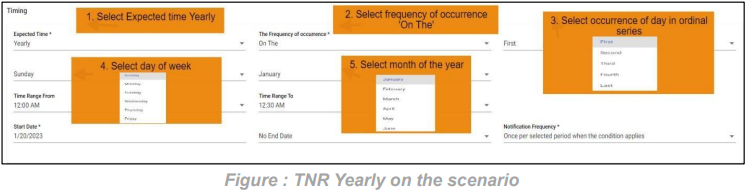
When we don’t receive a transaction like 850,810 etc. for any particular entity and when the count of the transactions expected was not matched with the transaction received count then the Transaction not received alert will rise. This alert lets the user know that the expected transaction has not been received for the entity Transaction not Received alert will notify the user if the configured expected count of transactions does not match with received transaction count for the particular entity. We can configure the files count while creating alert as shown below.
Path:
Login  Alert Management TNR
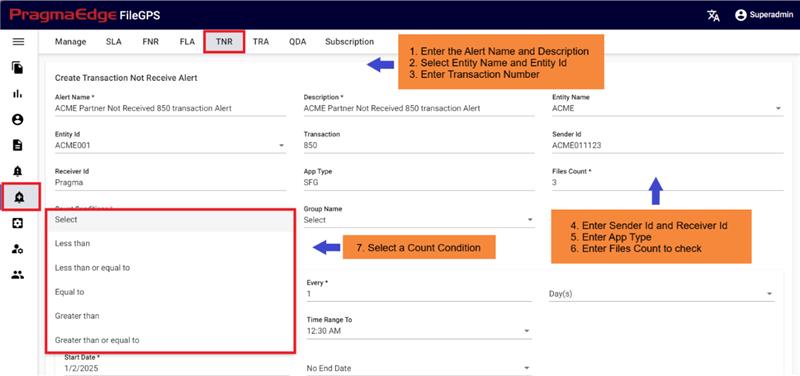
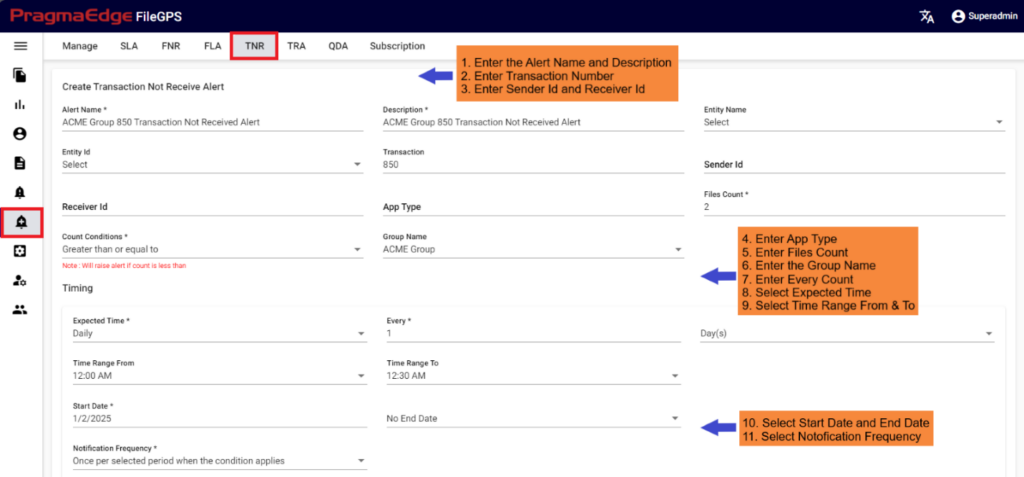
We have two scenarios for configuring TNR alerts: one is TNR for entities, and the other is TNR for groups.
TNR Alert for Entity:
In the below figure user has configured the TNR Alert ‘ACME Entity Not received 850 transaction Alert’ to receive notifications if configured transaction not received.
In the Alert details please enter the alert name, description and select entity and entity id as well. enter the transaction number in transaction field to match while checking the transactions. Enter Sender ID, Receiver ID, App Type and please enter the files count of the files to match with the received files count condition.
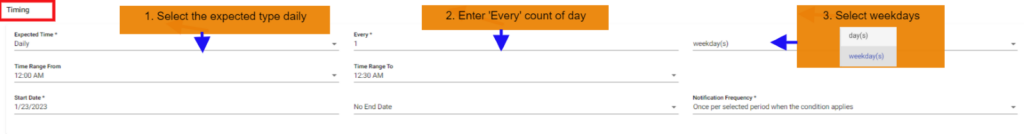
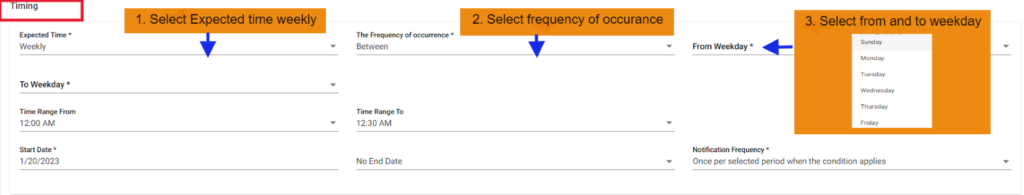
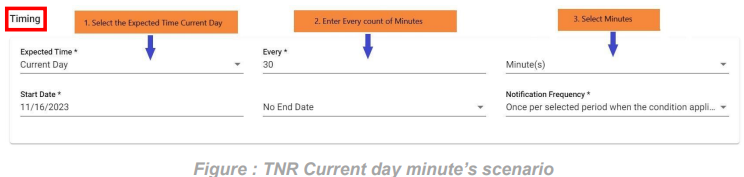
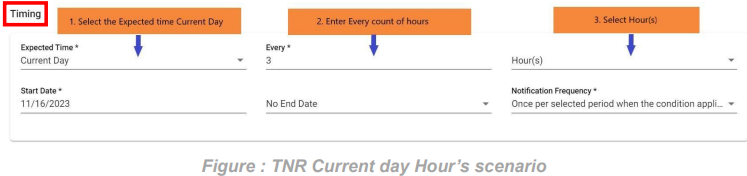
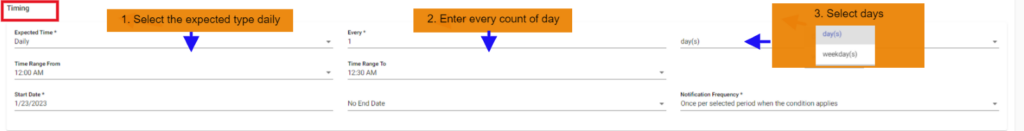
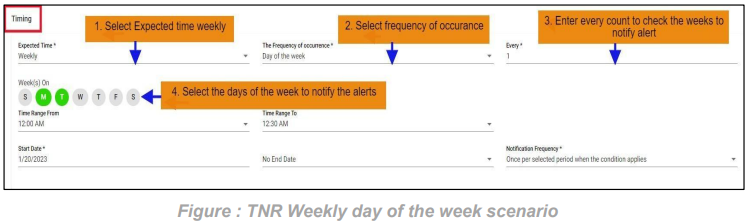
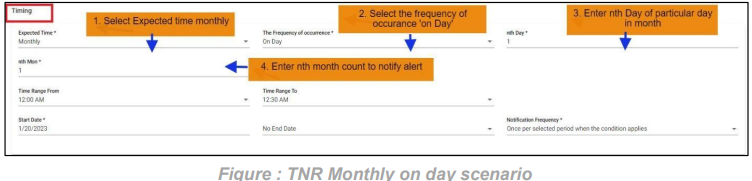
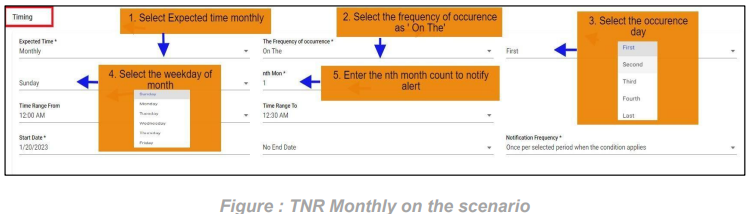
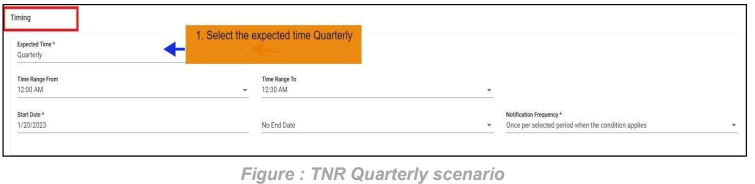
In the Timing details please enter the expected time when we are expecting this alert to be notified as we have provided options like daily, weekly, monthly, quarterly and yearly details. We have provided a detailed explanation regarding these after the alert created with heading ‘Timing of TNR in detail’.

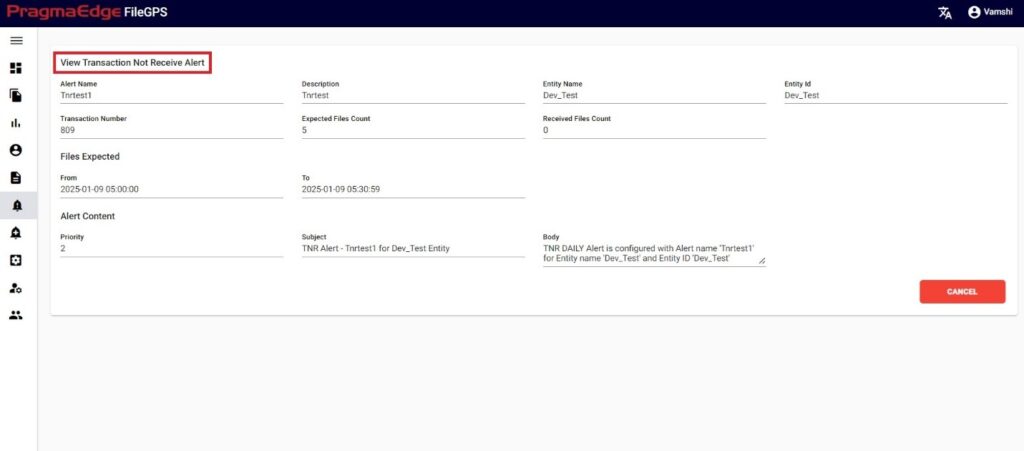
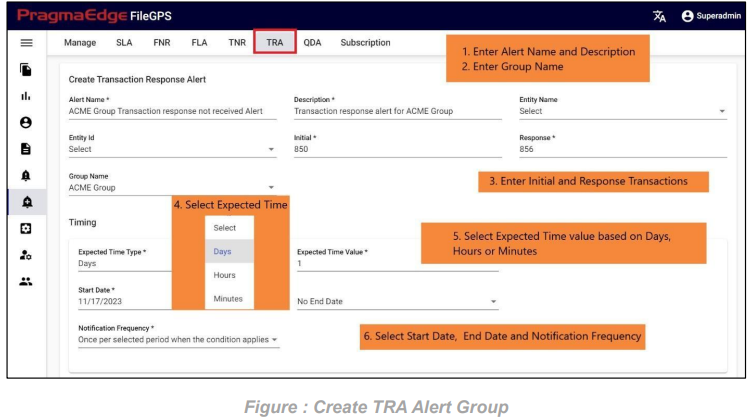
In File Transfer process, if the transaction is not received to its destination, in other words, if transaction of a file from initial stage to response stage is not received in the given time interval, then ‘TRA’ Alert is raised.
This alert let the business team know that the transaction has not been received for the entity. In this compilation process of file case, we can check where the process event has stopped for any Entity.
Path:
Login Alert Management TRA
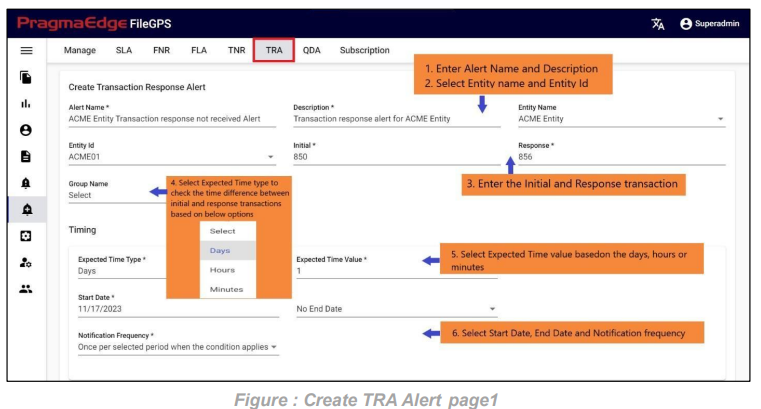
TRA Alert for Entity:
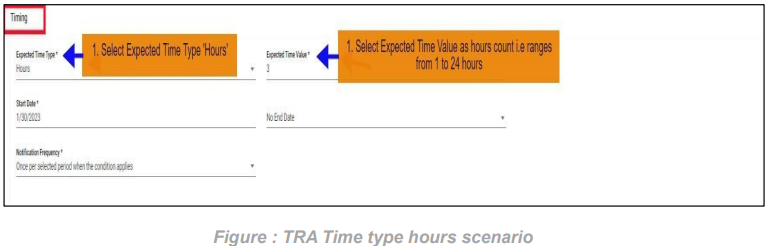
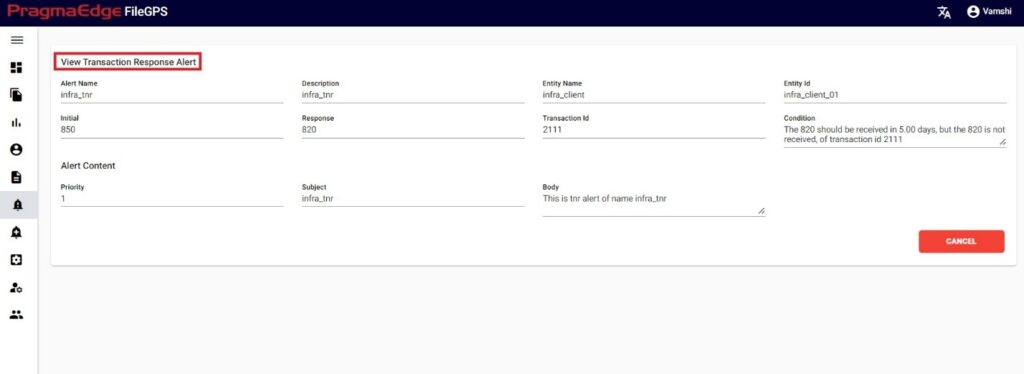
In the below figure user has configured the TRA Alert by giving alert name as ‘ACME Entity Transaction response not received Alert’ and entity as ACME Entity, Entity Id as ACME01. In the Alert details please enter the alert name, description and select entity name and entity id as well. enter the initial and response transaction numbers to check transaction of a file from initial stage to response stage is not received in the given time interval.
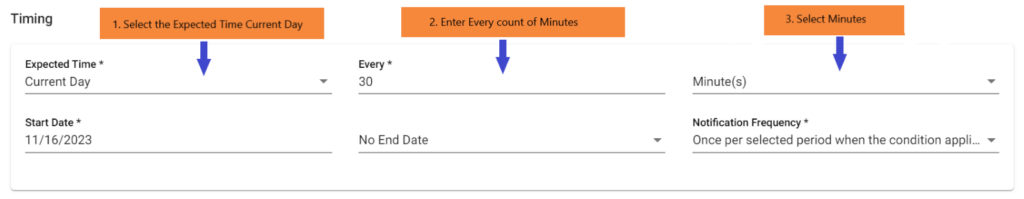
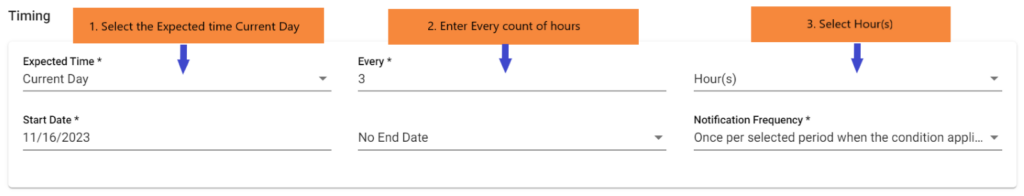
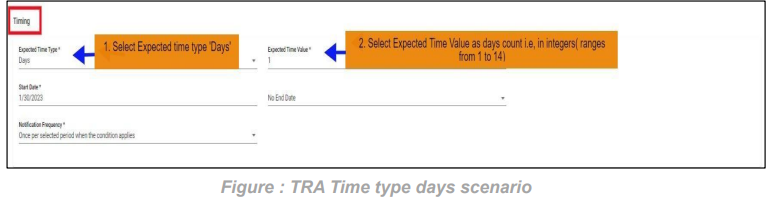
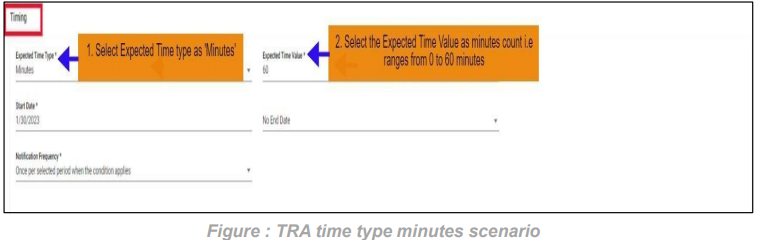
In the Timing details please enter the expected time type to check the time interval like days, hours, minutes. We have provided a detailed explanation regarding these after the alert created with heading ‘Timing of TRA in detail’.
Queue Depth Alert will be raised when user having files with Particular Agent for given Queue Name, when the depth of the files in the particular queue reaches the configured value count it will raise the alert.
For This Queue depth alert, we have default agents to be entered were Kafka, SI and MQ. We can configure this depth alert for any agent queues to check its depth and notify the alert.
Path:
Login Alert Management QDA
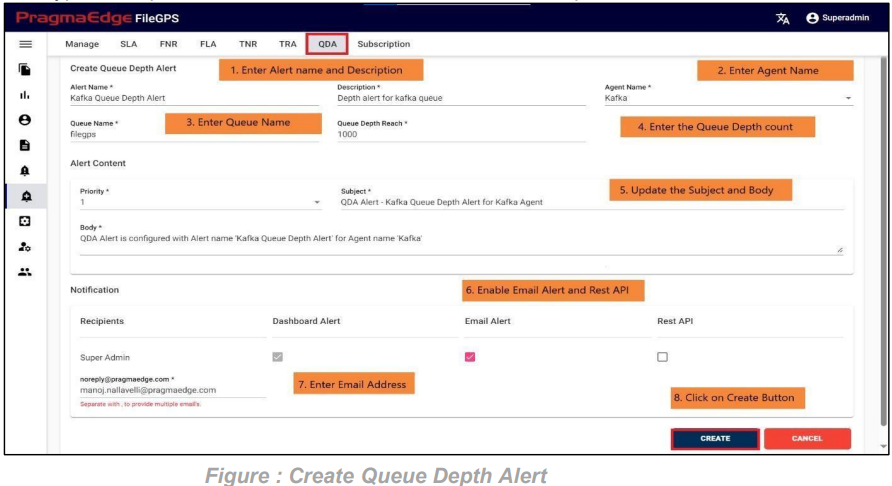
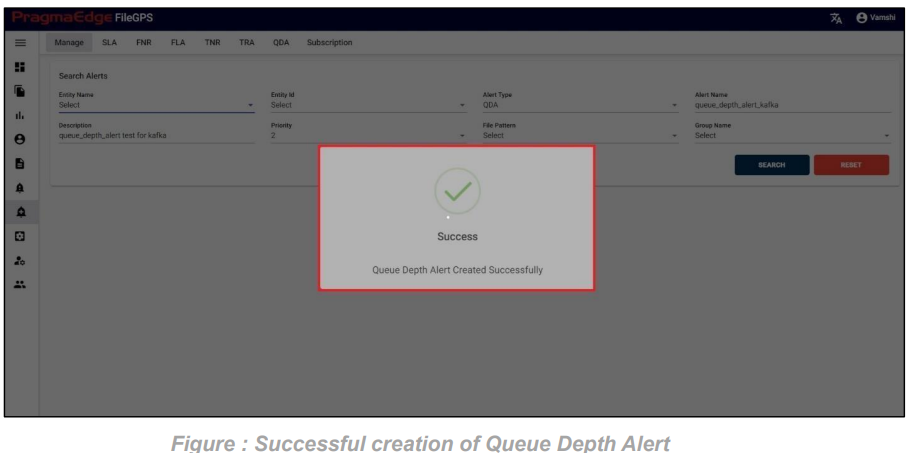
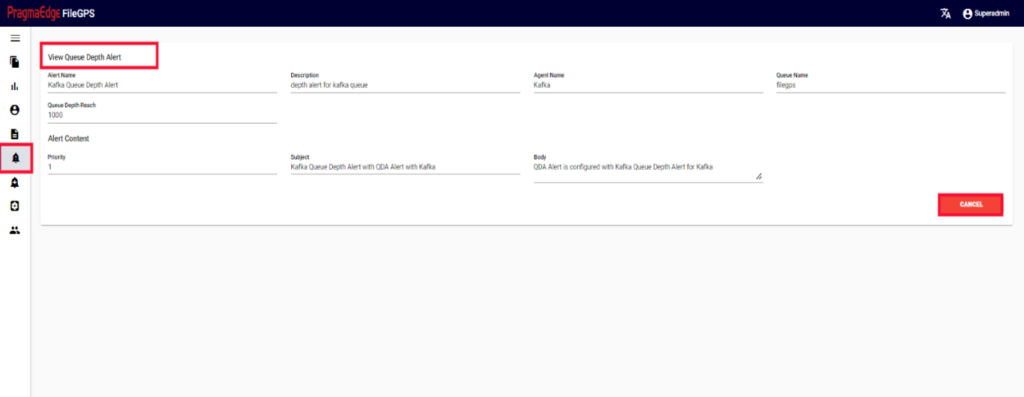
In the below figure user has configured the QDA Alert by giving alert name as ‘Kafka Queue Depth Alert’.
In the Alert details please enter the alert name, description and enter agent name and queue name as well. Now enter the depth count to check the queue depth of the particular agent.
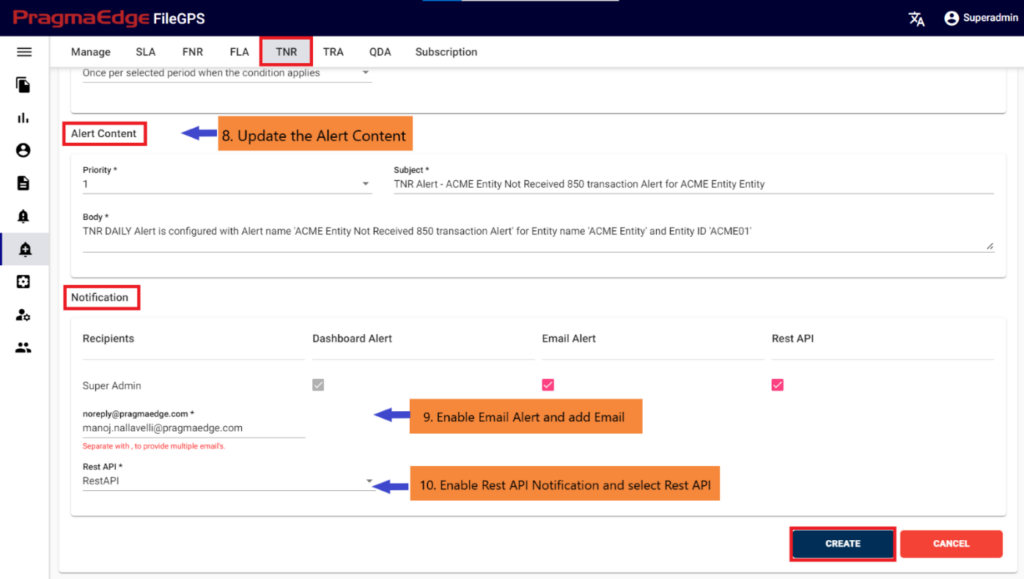
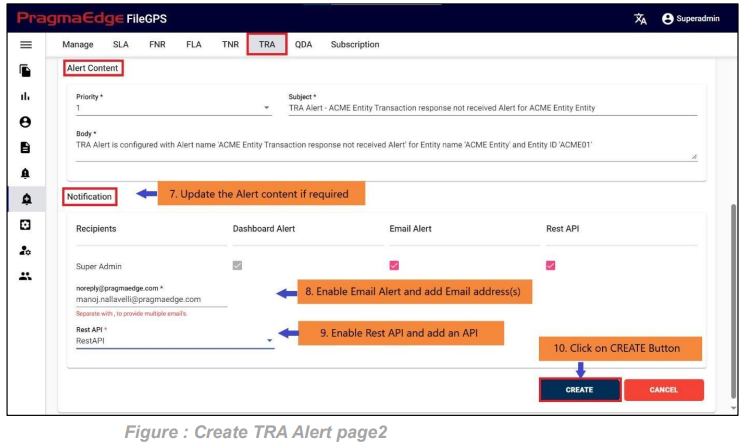
Update the alert content details by providing the priority of the alert to be in alerts modules, subject and body will be default added with some selected alert information. Update it if required.
In notifications details dashboard alert notification is default selected for every alert and please enable the other notifications email and rest API by providing the details required as shown in below figure. If we enable the email notification, please provide an email address. Similarly, if we select the rest API notification, please provide the method of API whether post or put, URL and auth type with options no auth and basic auth with username password details.
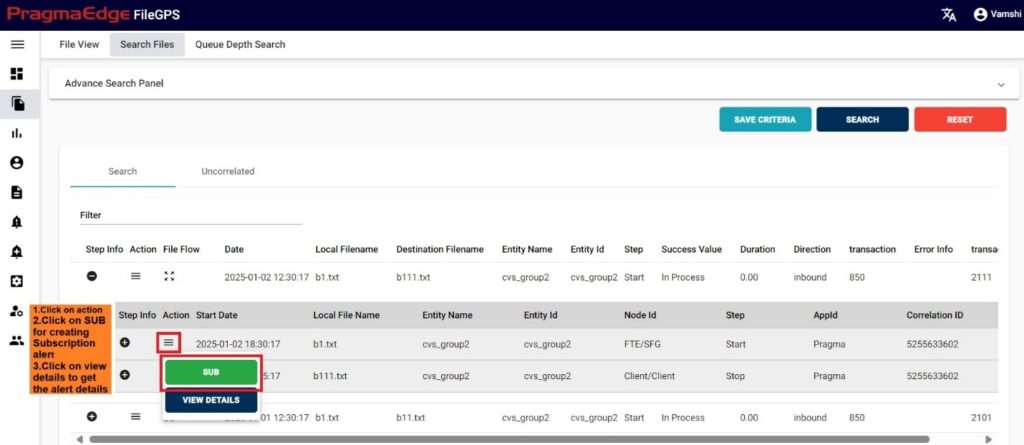
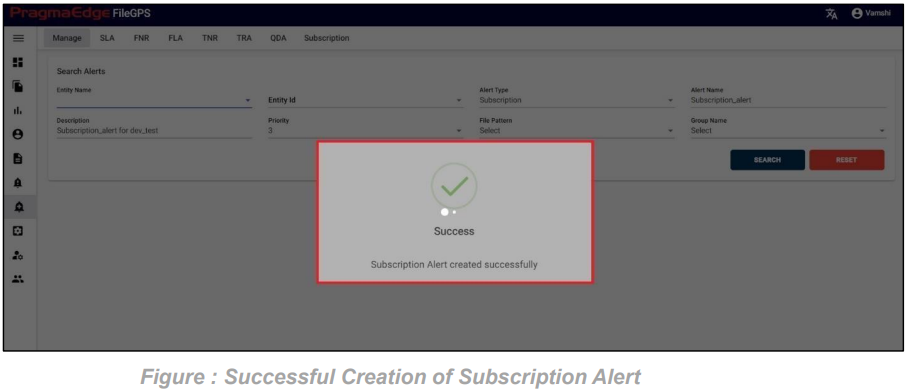
Subscription Alert will be raised when user subscribes to a particular event in the file transfer process and a file matches a particular subscription.
In a file transfer we have many stages of file such as start, process, reprocess, error and stop. Here in this subscription alert, we can subscribe to any stage of the file by configuring the type while creating the subscription alert. So, when the particular stage of the file arrives it notifies the alert to the subscribed user.
Path:
Login Alert Management Subscription
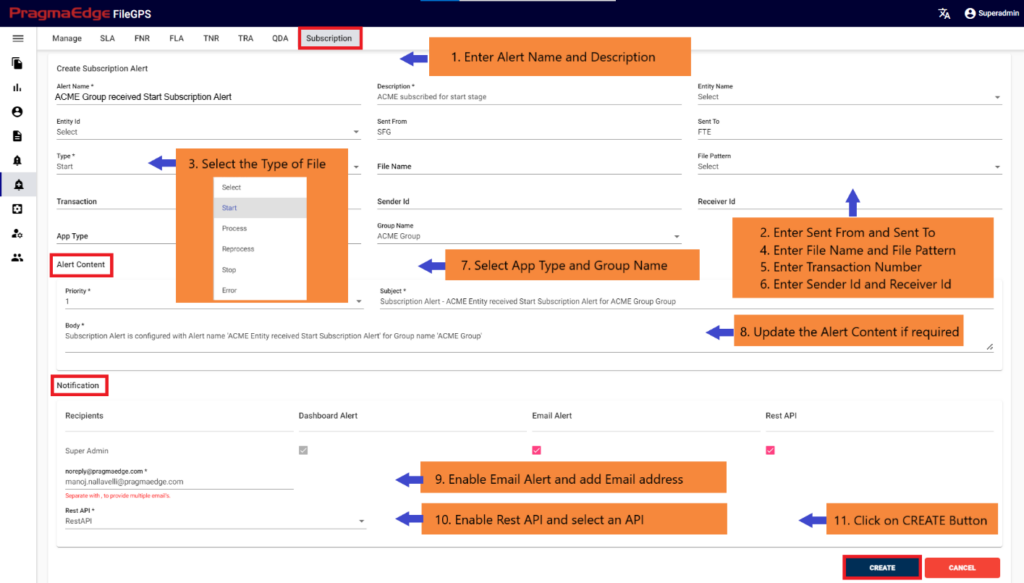
We have two scenarios for configuring Subscription alerts: one is Subscription for entities, and the other is Subscription for groups.
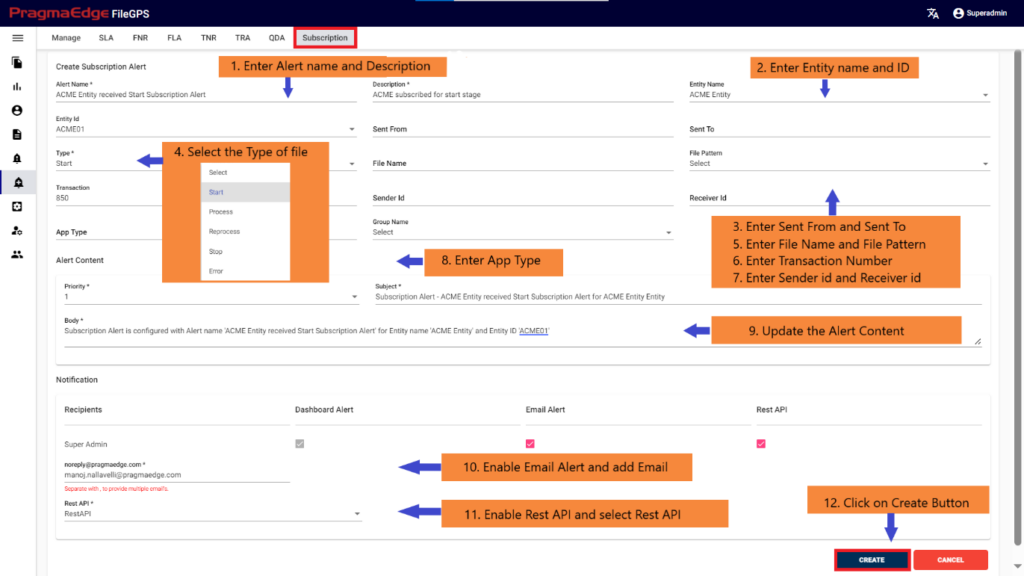
Subscription Alert for Entity:
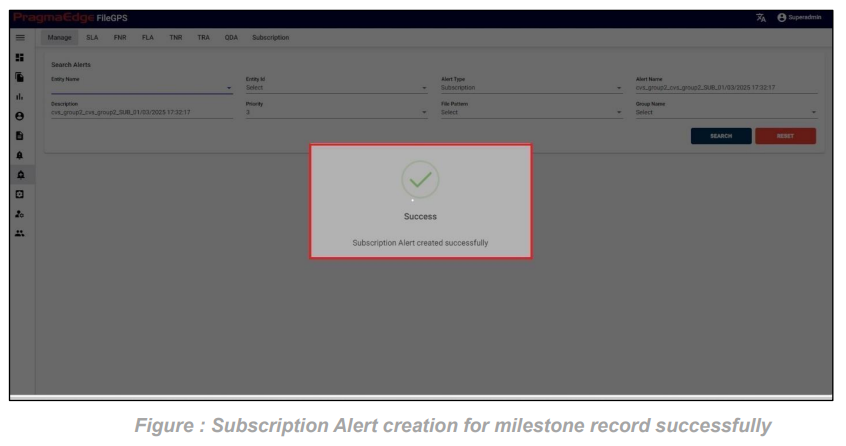
In the below figure user has configured the Subscription Alert ‘ACME Entity received Start
Subscription Alert’.
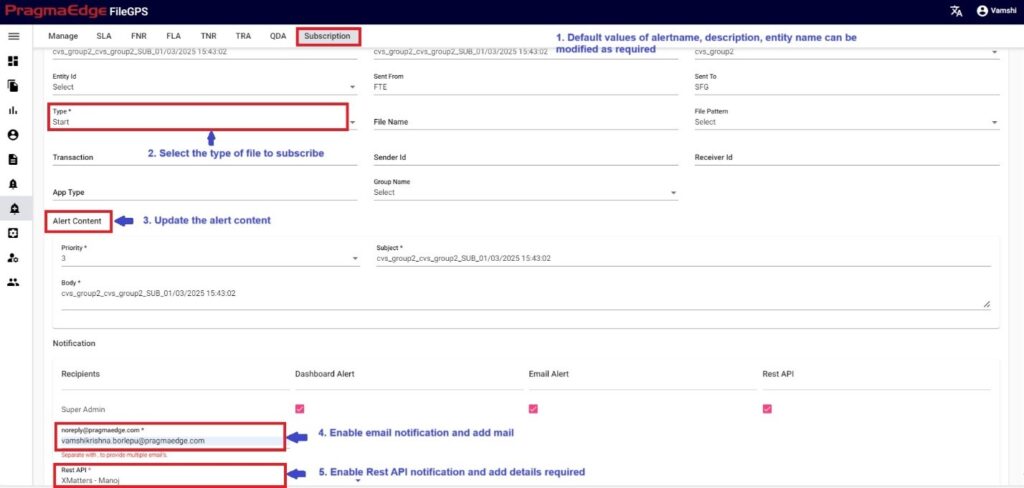
In the Alert details please enter the alert name, description and select entity name and entity id. Enter sent from and sent to details as well. Similarly select the type of the file to match the stage of the file arrived to notify alert. Input the File Name, File Pattern, Transaction, Sender Id, Receiver Id, and App Type to specify the conditions if the user desires to match a particular set of criteria.
Update the alert content details by providing the priority of the alert to be in alerts modules, subject and body will be default added with some selected alert information. Update it if required.
In notifications details dashboard alert notification is default selected for every alert and please enable the other notifications email and rest API by providing the details required as shown in below figure. If we enable the email notification, please provide an email address. Similarly, if we select the rest API notification, please select an API from the drop down.
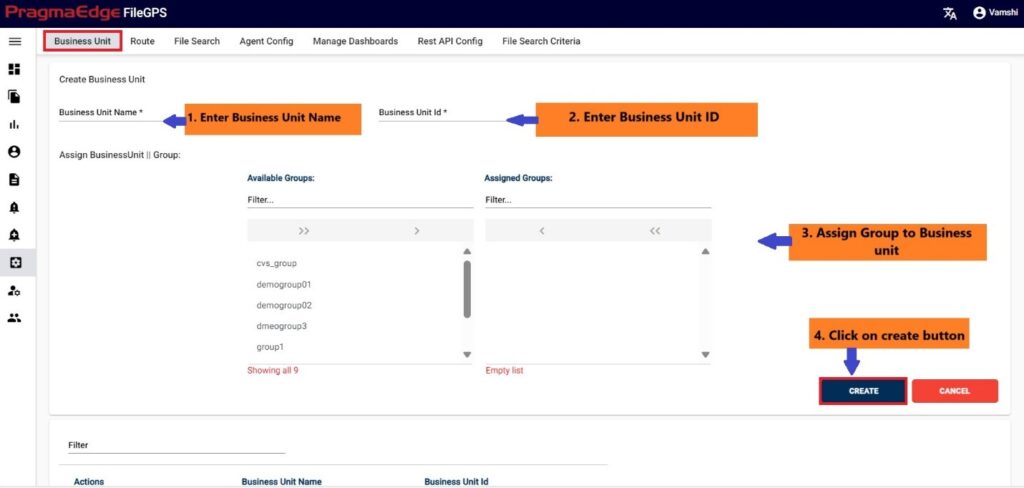
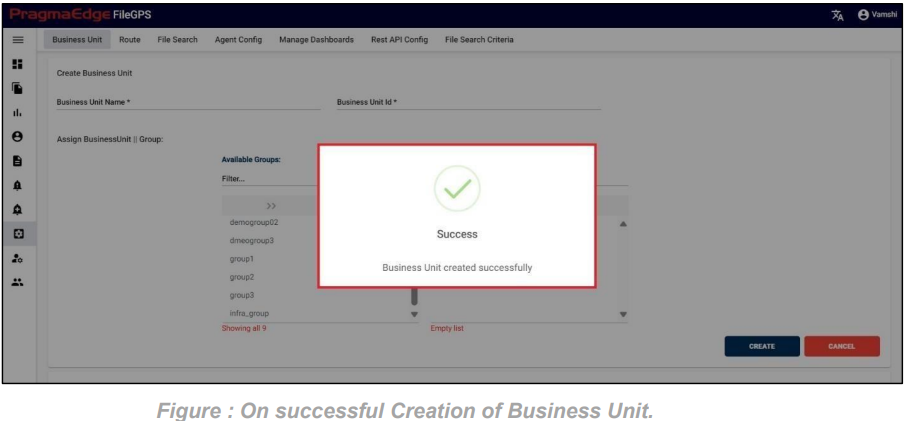
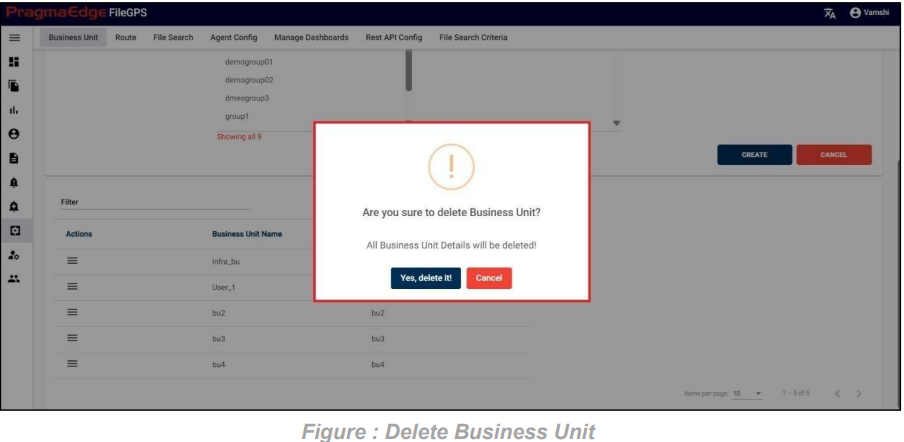
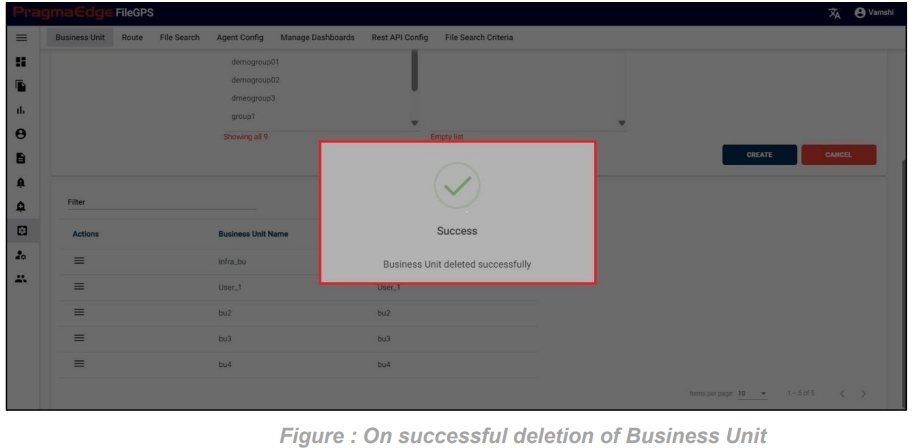
A business unit is an organization or organizational subset that is independent of one or more accounting or operational functions. The admin will configure the business unit and assign the groups associated for the business unit based on access level.
Path:
Login Configure Business Unit
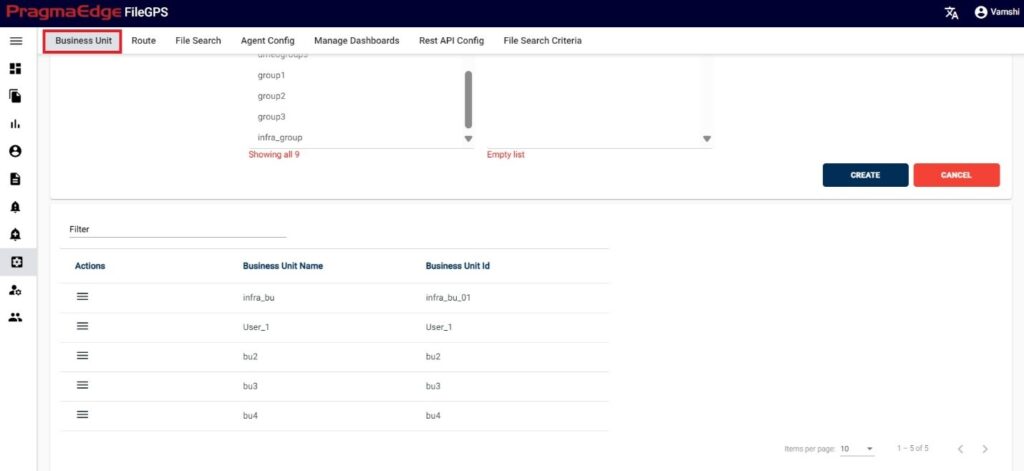
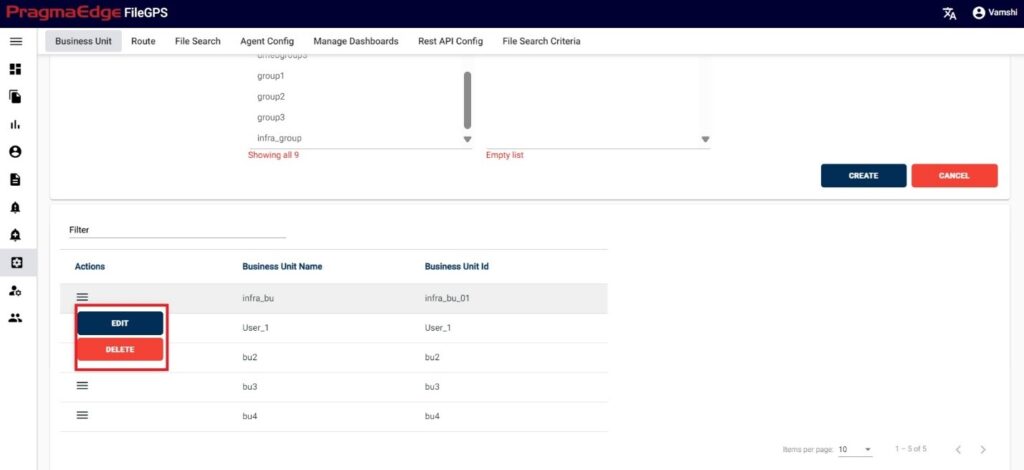
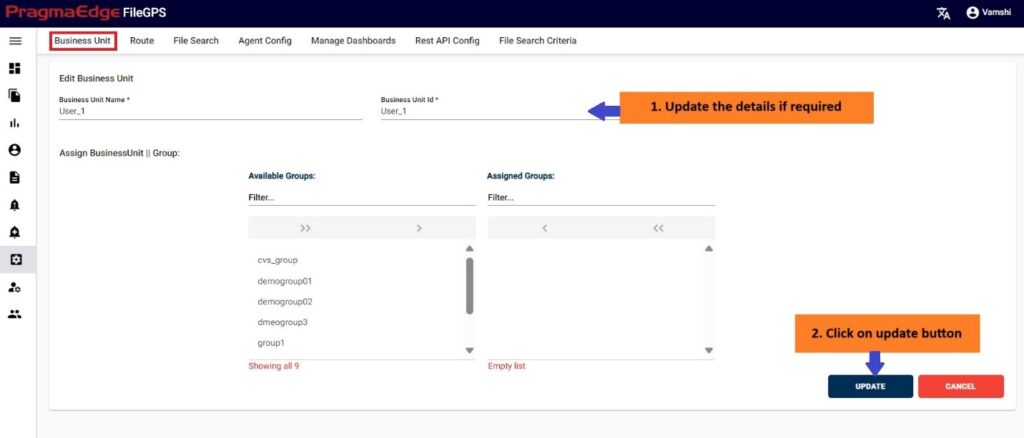
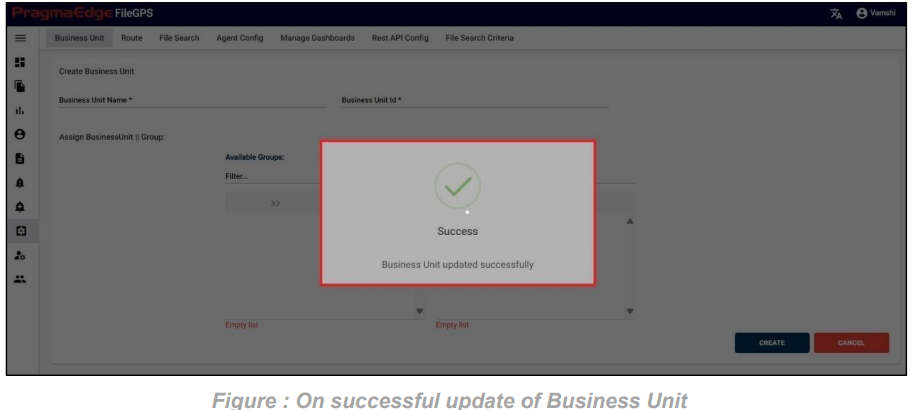
By clicking on the business unit sub menu. It will land on the create business unit page where we will provide details of the business unit to configure. In the below figure user has configured the Business unit ‘CSR Team’ for the ACME Group.
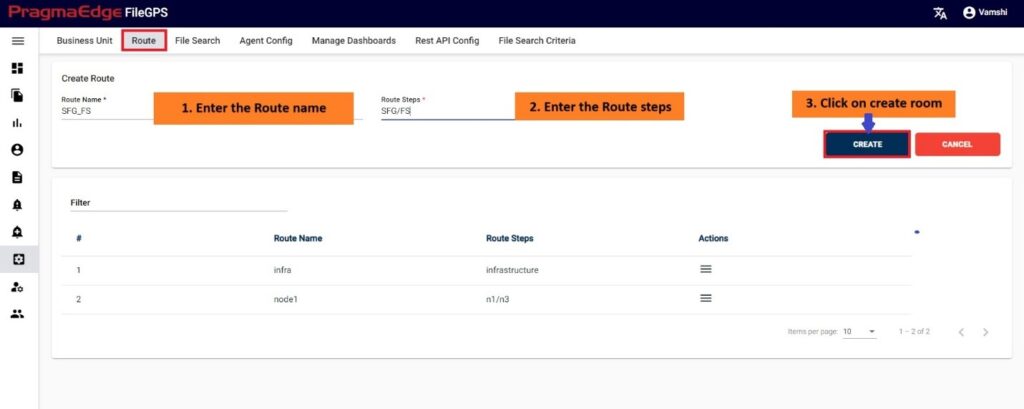
Route means the various communication channels the trading partner use to transmit the file from a source application and destination application. User can configure the Various routes that Entity will expect the file from their Trading partners.
Path:
Login Configure Route
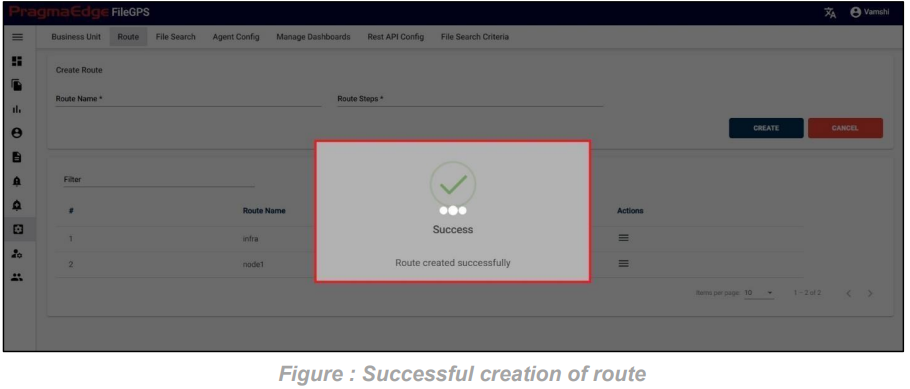
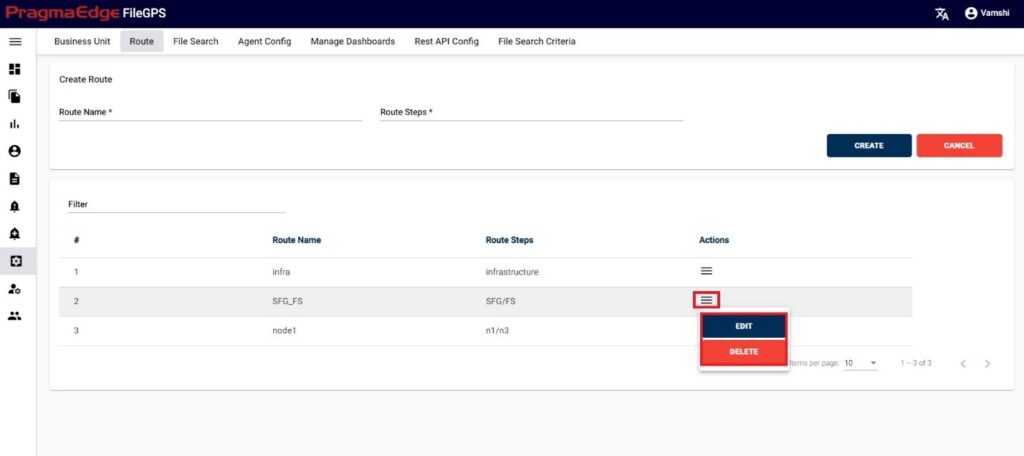
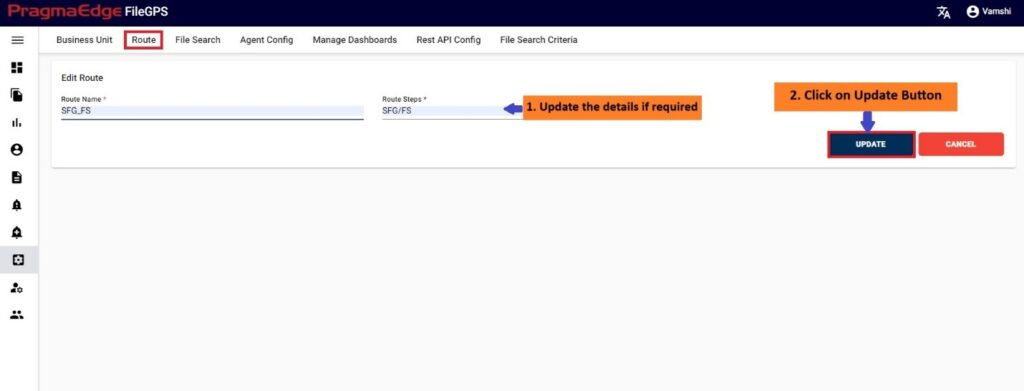
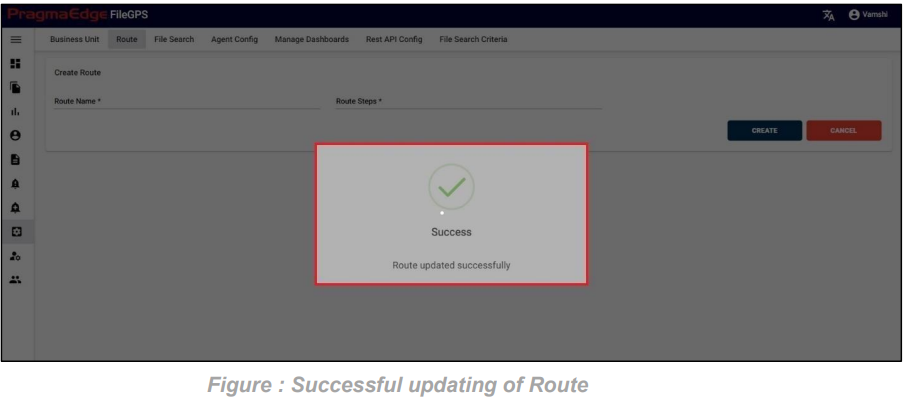
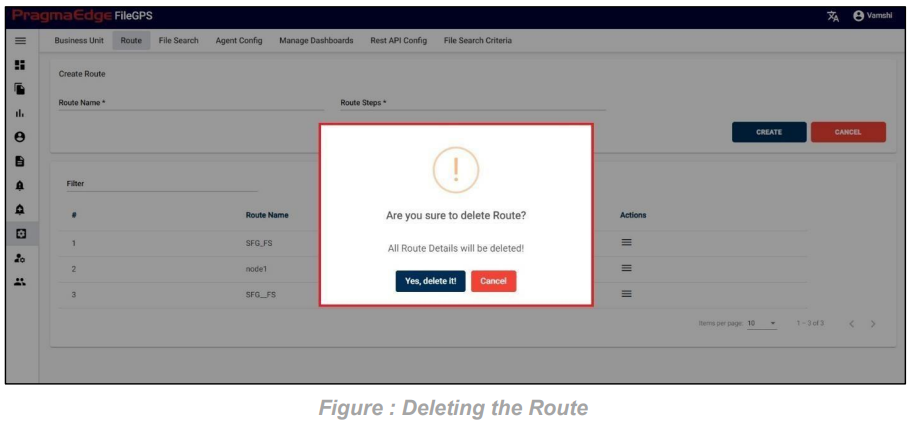
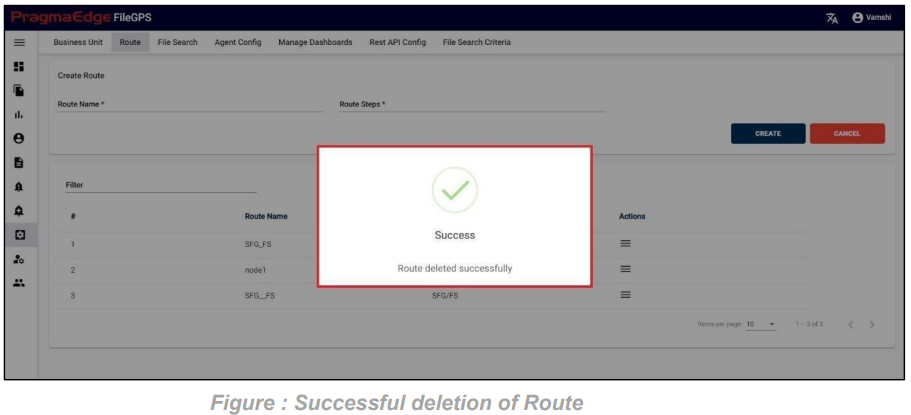
By clicking on Route sub menu. It will land on the create Route page where we will provide details of route to configure.
In the below figure user has configured the Business unit ‘SFG to FS’ for the ACME Entity.
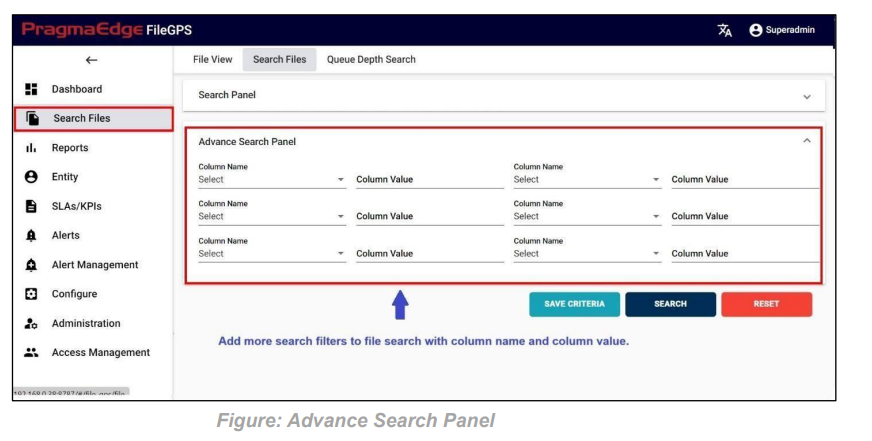
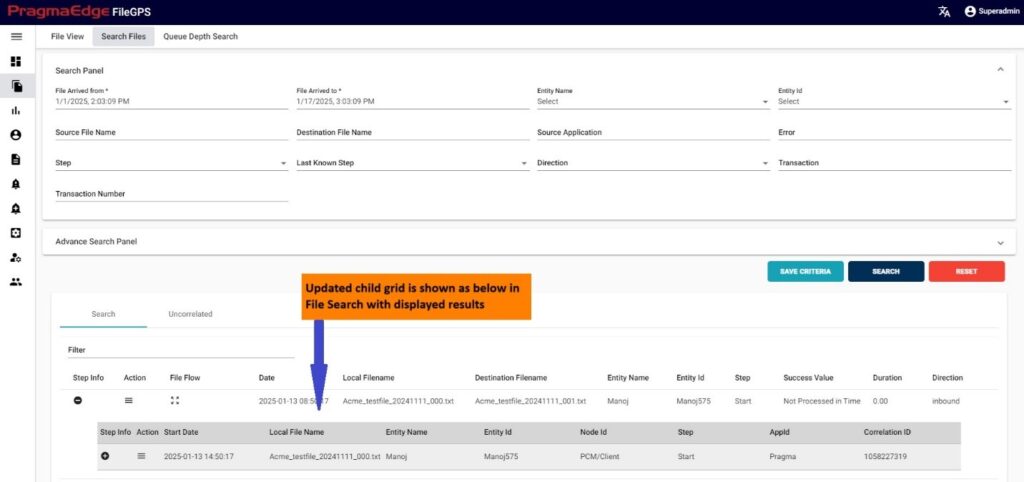
Users can personalize the File search with desired fields that they want to view in the different kinds of grids of File Life cycle.
Path:
Login Configure File Search
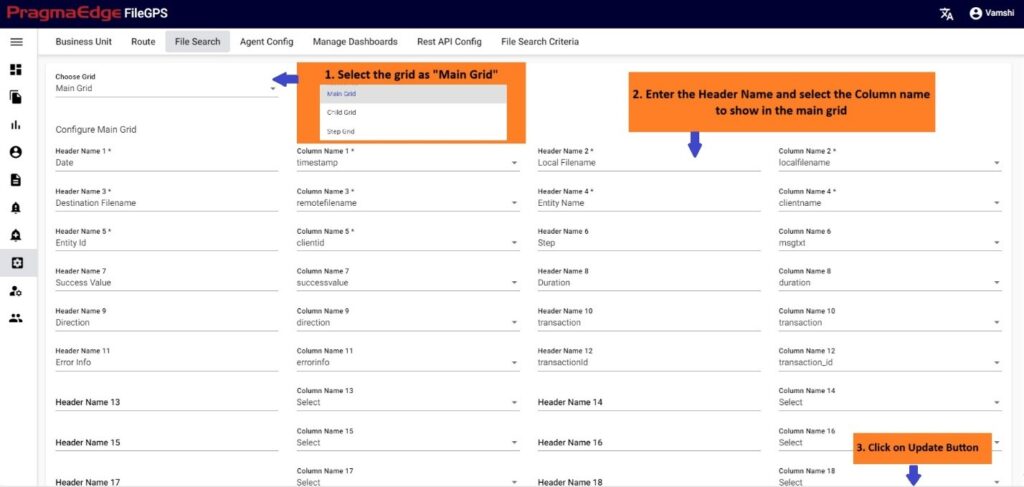
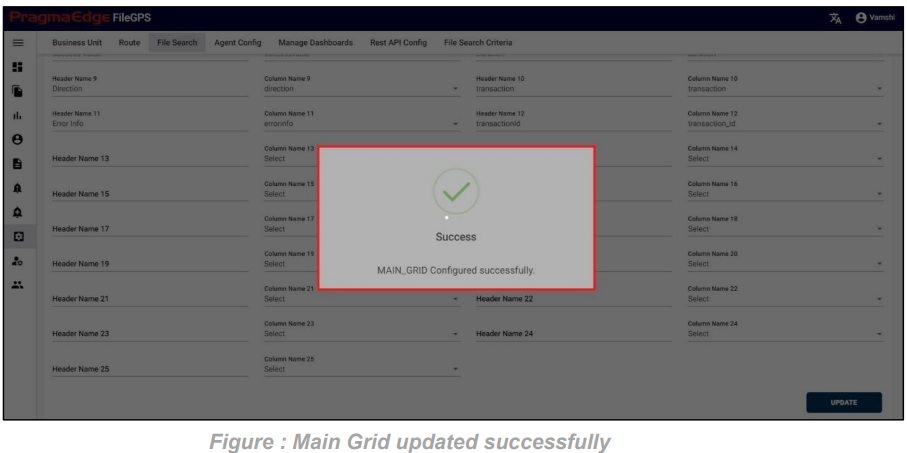
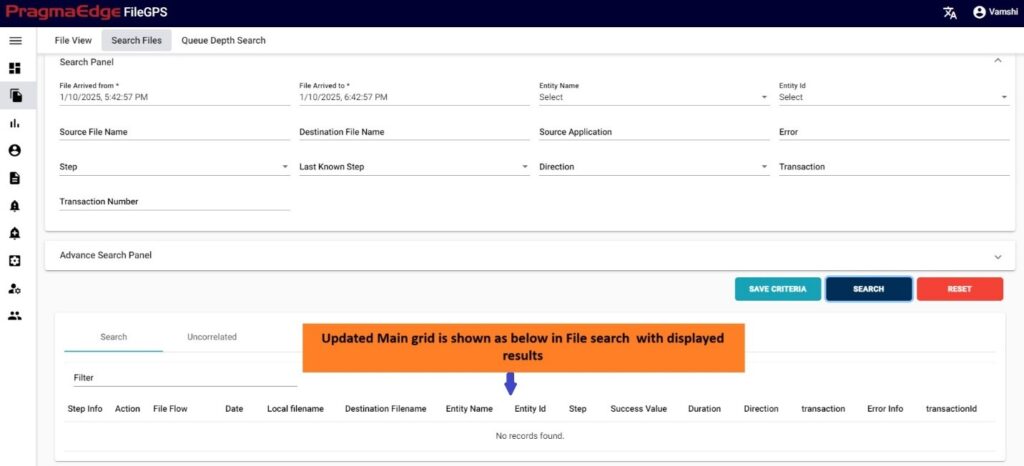
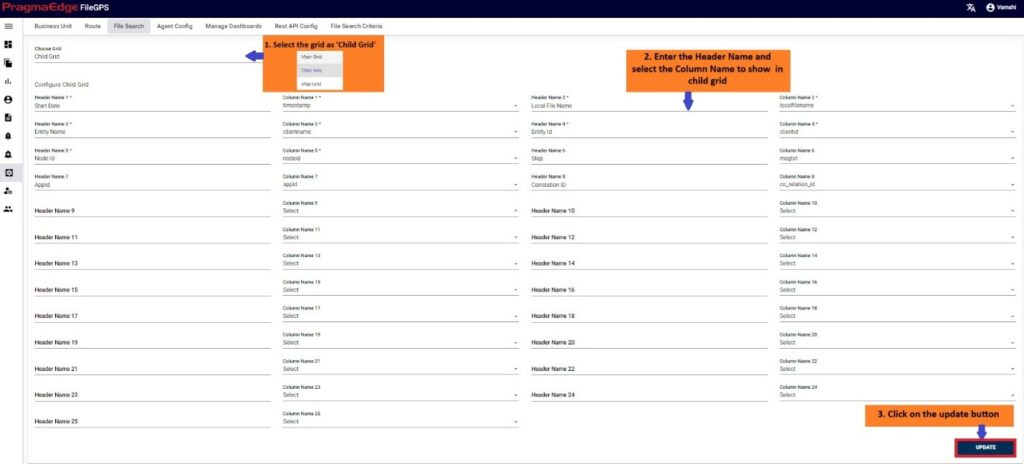
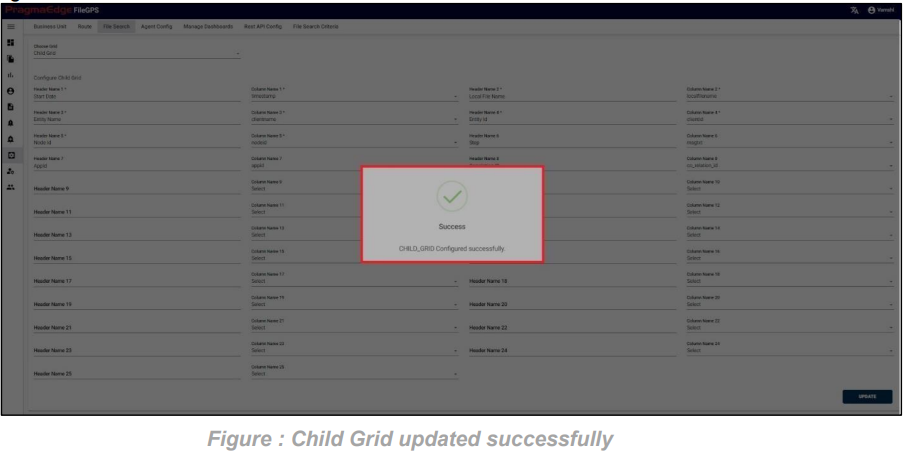
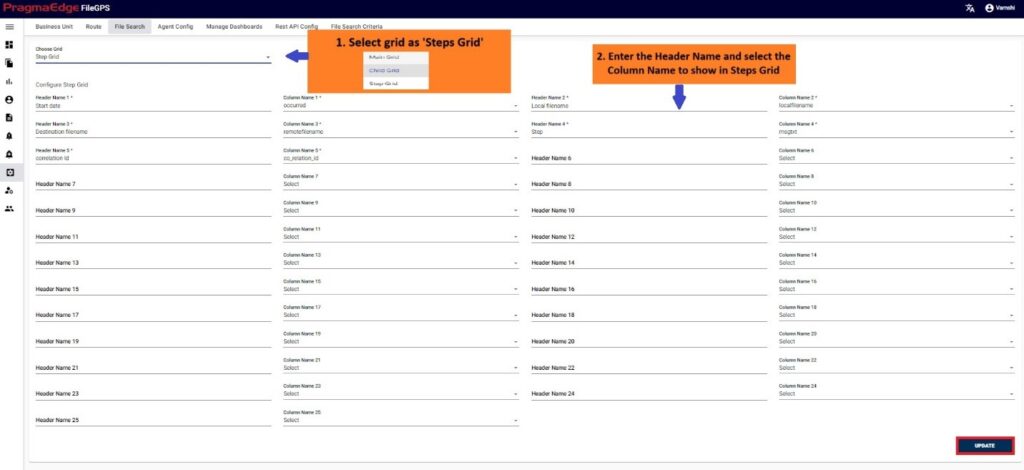
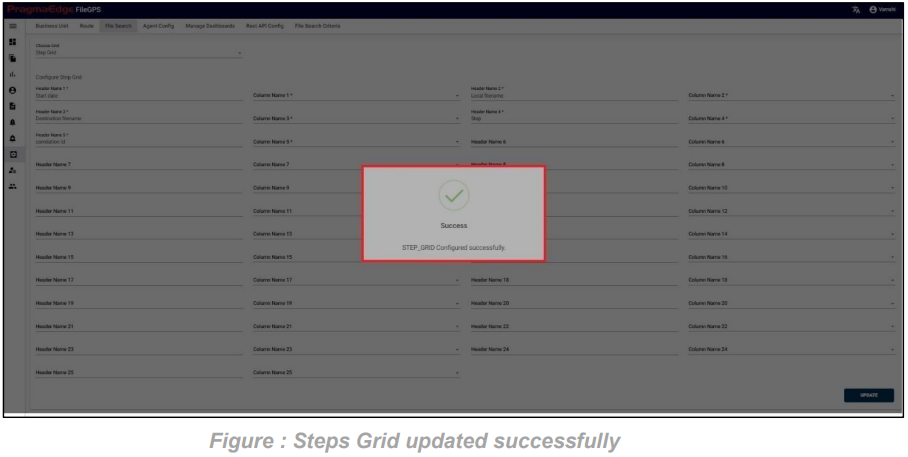
In this file search we can configure different kinds of grids like main grid, child grid and step grid. Users can select or deselect the fields in sections accordingly so we can view the information of configured fields in the search file page results. By default, it shows Main Grid as filled in choose grid field
a. Main grid: In the below Figure User can select or deselect the fields in main grid config section.
Path:
Login Configure Agent Config
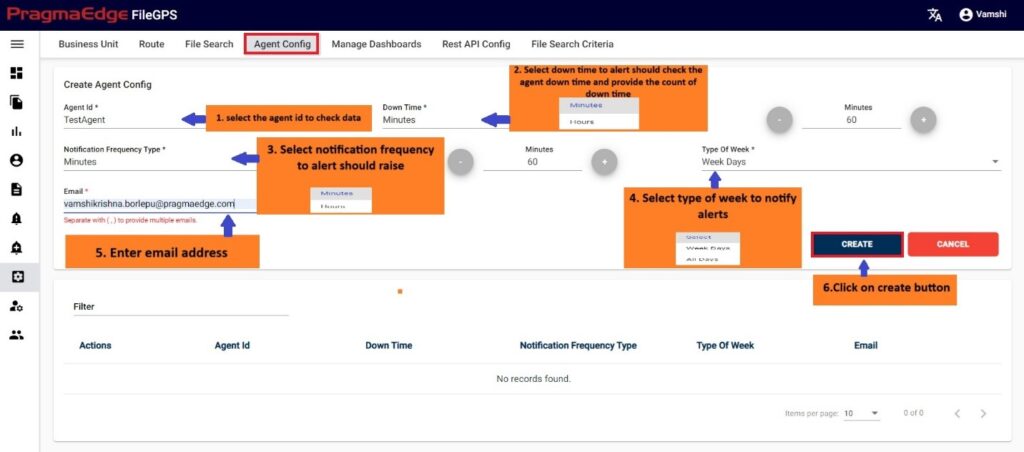
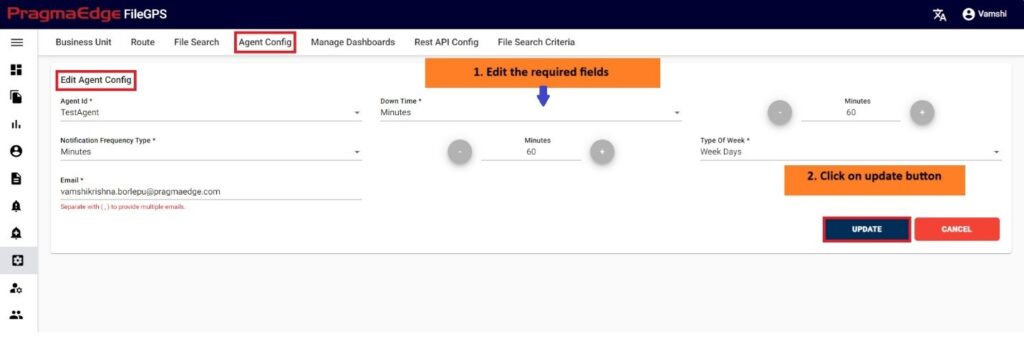
This Agent config raises an alert when the agent is down, in this we need to give some of the mandatory data for generation of the alert as follows:
1.Down Time: Which will get values in minutes/hours -> This value determines the after how much time once an agent is down, an alert should be raised.
2.Notification Frequency Type: Which will get values in minutes/hours ->This value determines how frequently an alert should rise. Once the agent’s down condition is met.
3.Email: Which gets multiple mail ID’s separated by comma. -> The Mail ids to which alert should be raised once the FileGPS Entity is down for specified down time which is configured above.
4.Notification Days: It should take two-values weekdays or all days. -> This determines whether the alert should be raised on the weekdays or all the days.
5.Agent ID: we need to select an agent id to which we are checking for the data and generating
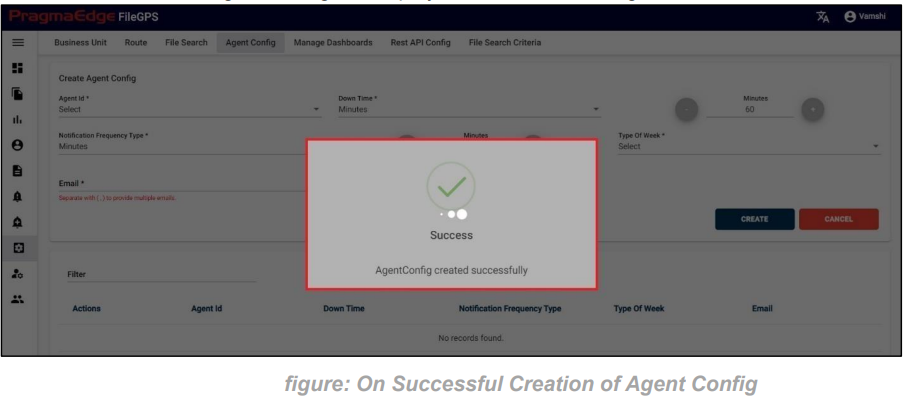
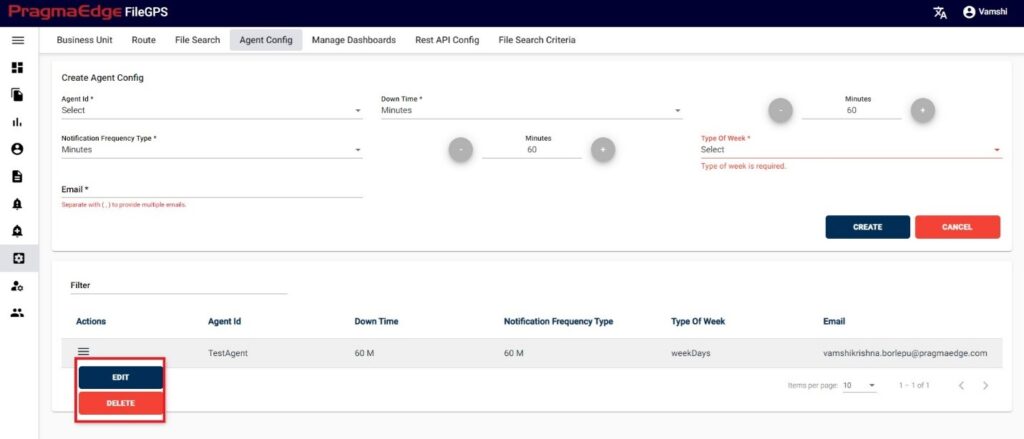
the Alert. In the below figure user has configured the creation of Agent Config Alert as follows:
Path:
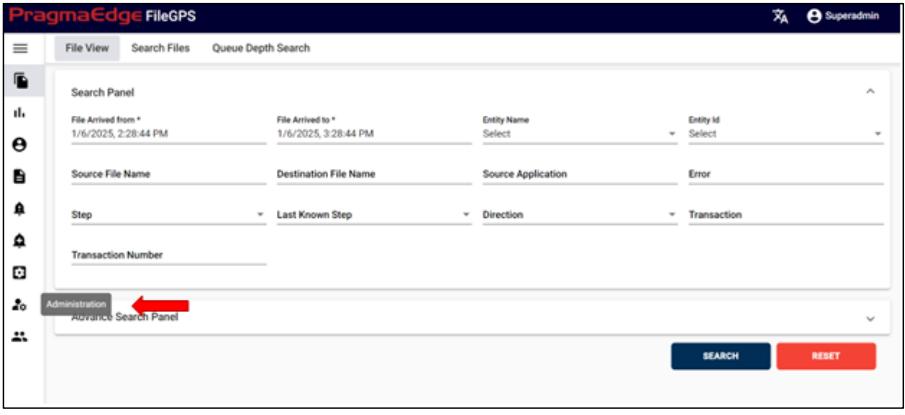
Login Administration Retention Policy
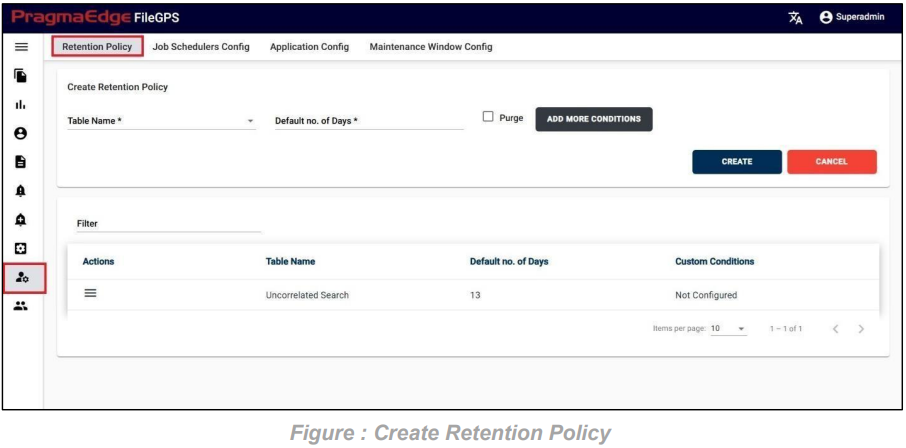
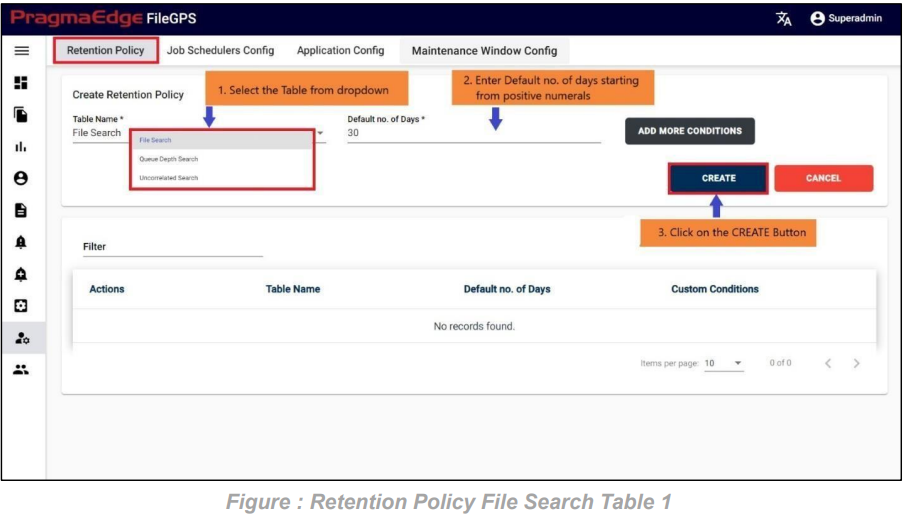
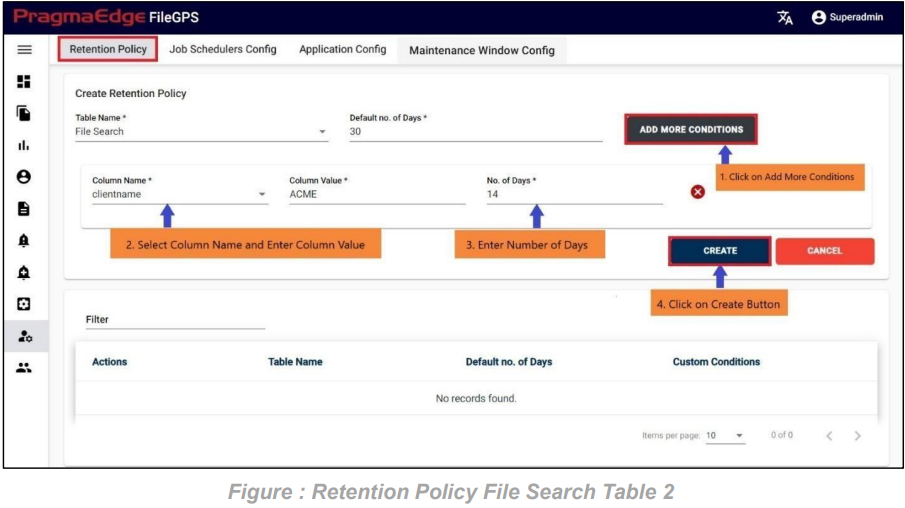
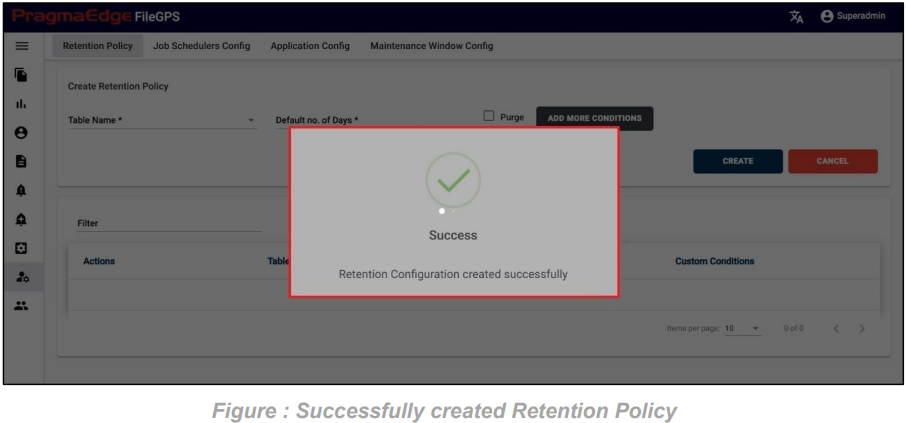
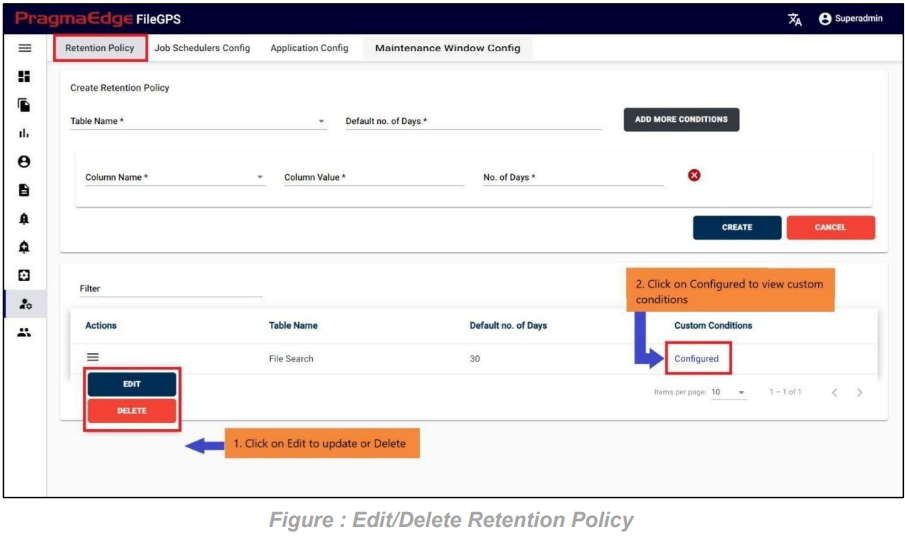
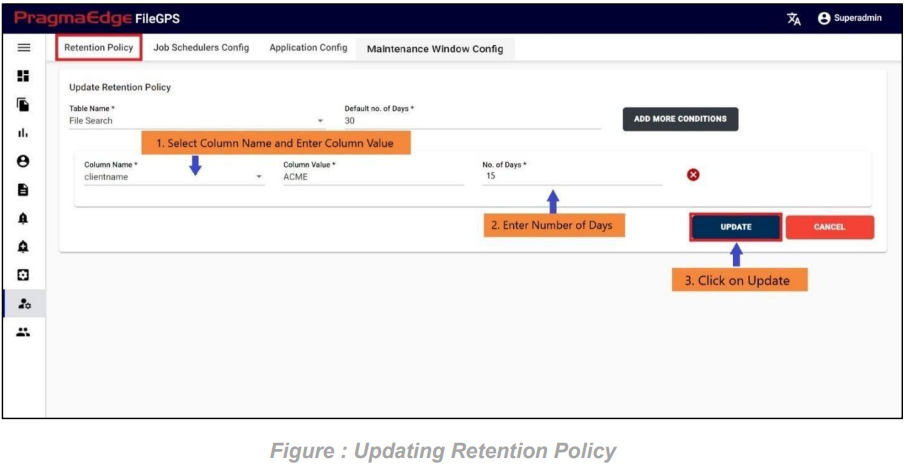
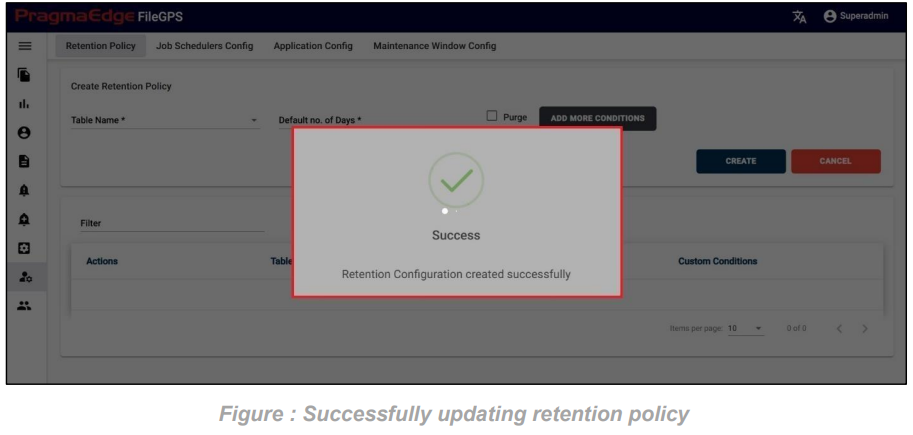
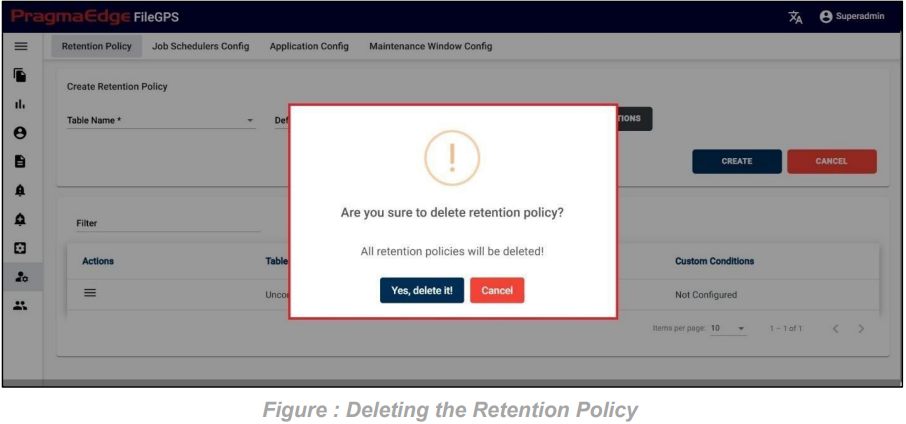
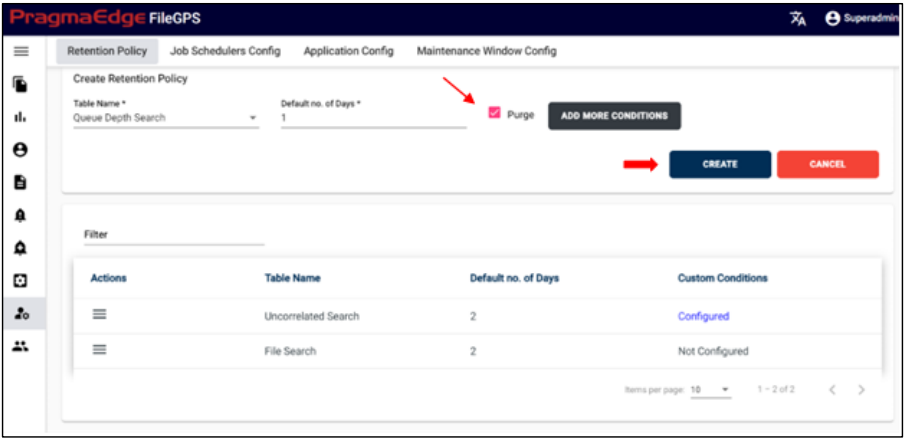
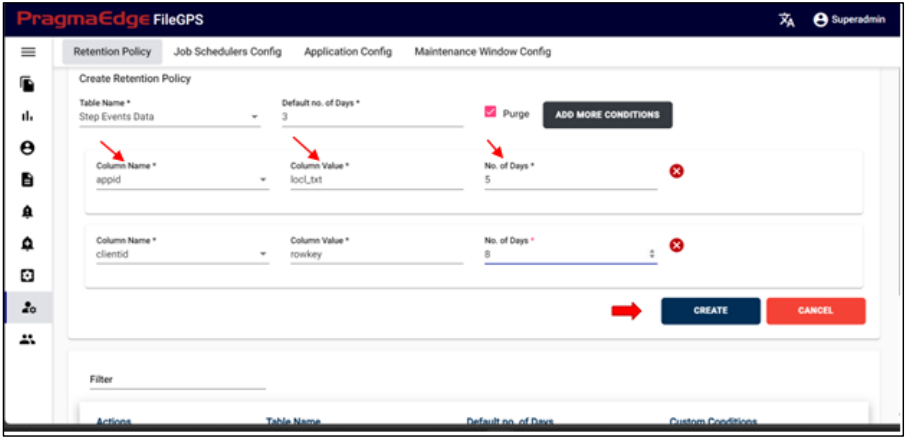
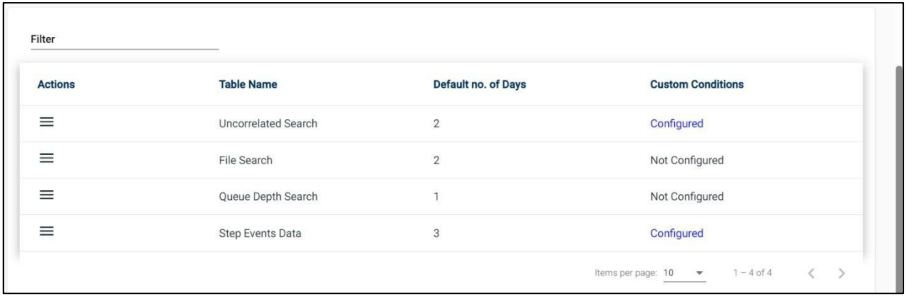
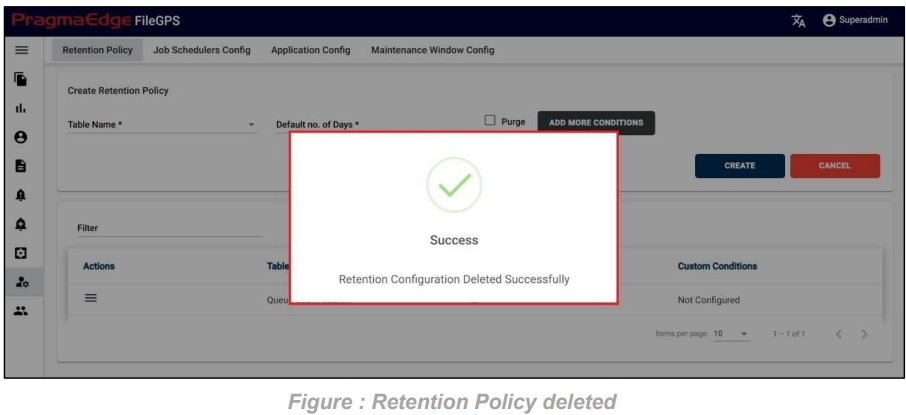
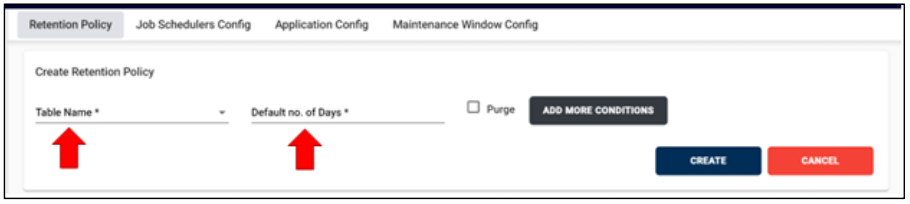
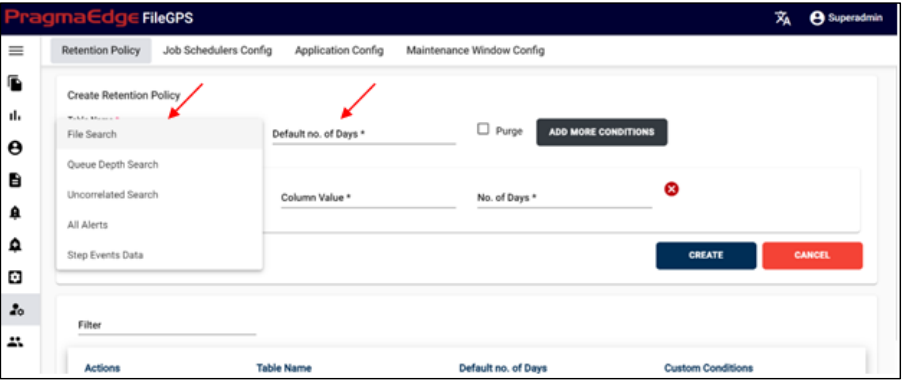
The administrator has the capability to create a retention policy via user interface as shown in the figure below. Within this UI, the administrator can select a specific table and define the default number of days. The implemented policy will govern the deletion of data from the selected table based on the specified number of days. This feature enables the efficient management and automated removal of data according to the established retention criteria.
Path:
Login Administration Job Scheduler Config
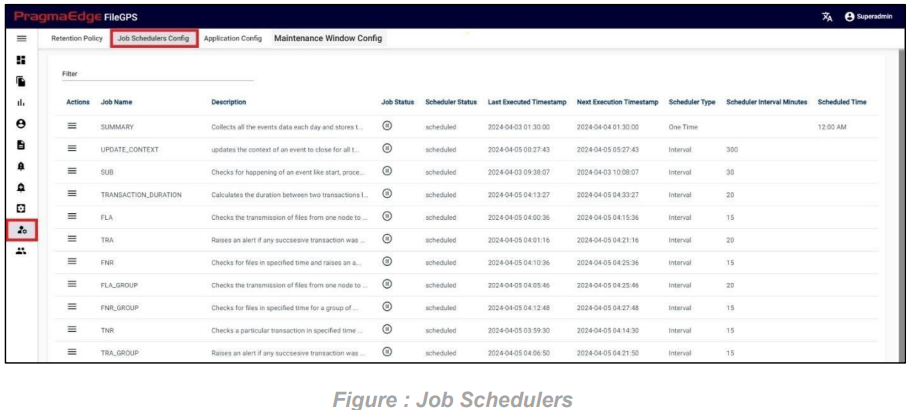
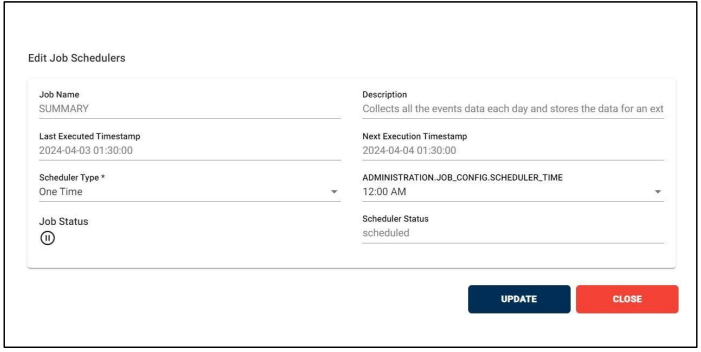
Users now have the capability to observe the scheduler status (backend job status) and manage them directly from the FileGPS UI. This includes functions like pausing, resuming, and updating the scheduler running time. Furthermore, users can access comprehensive details about the jobs, encompassing job name, description, last and next timestamps, scheduler type, and more.


Path:
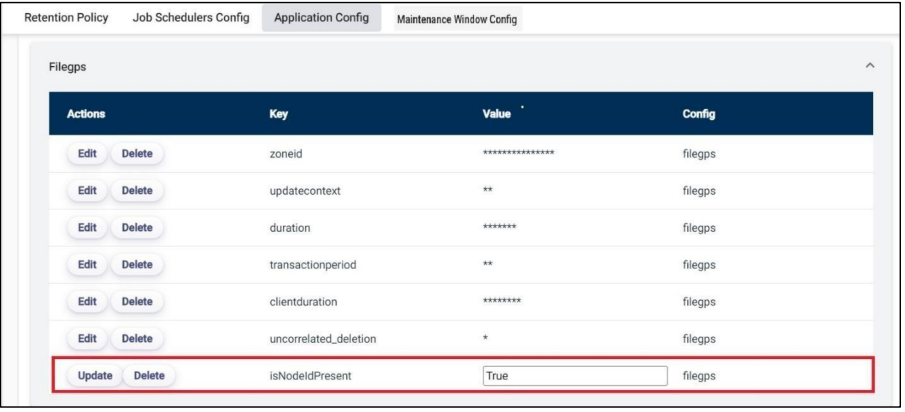
Login Administration Application Config
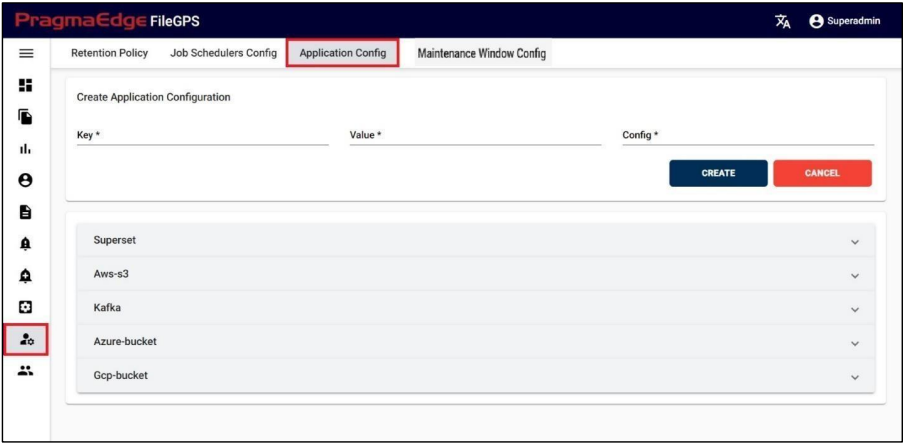
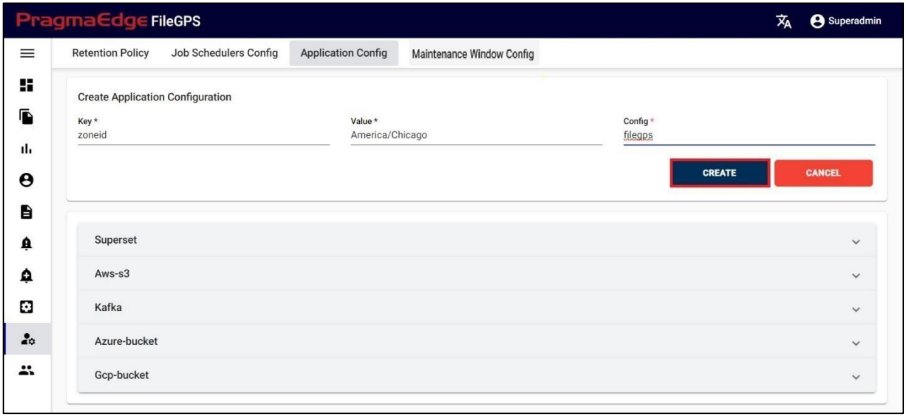
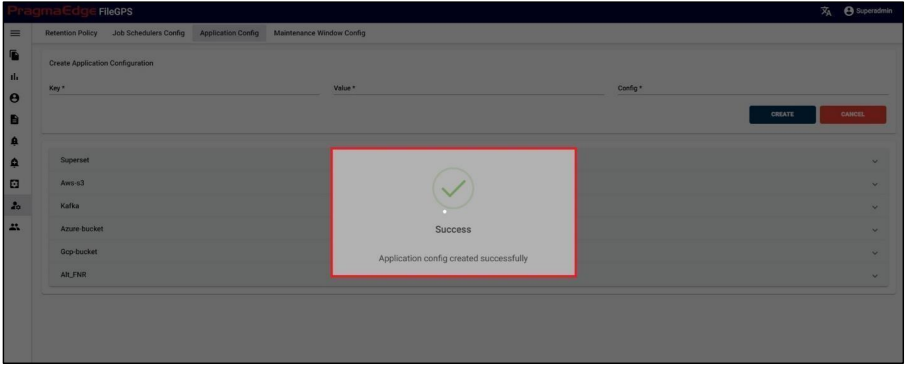
Users can configure application configuration directly from the FileGPS UI. This functionality includes adding, updating, and deleting YAML configurations through the Application Configuration page in the Administration Module.
Path:
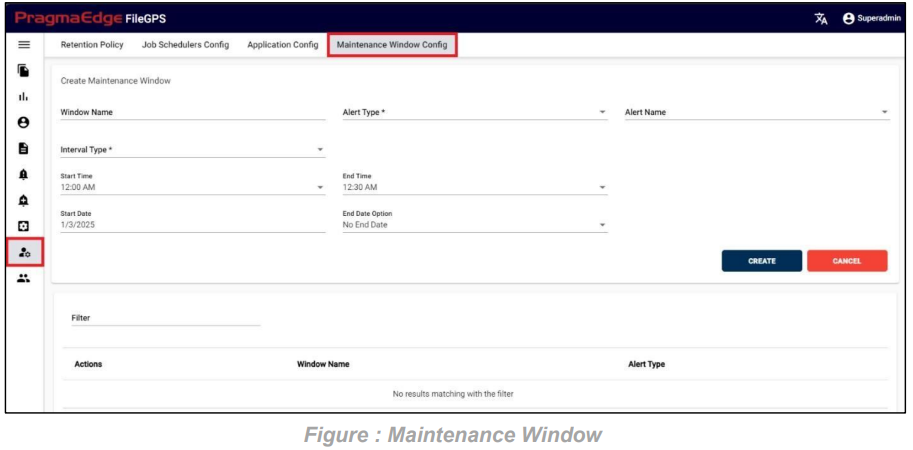
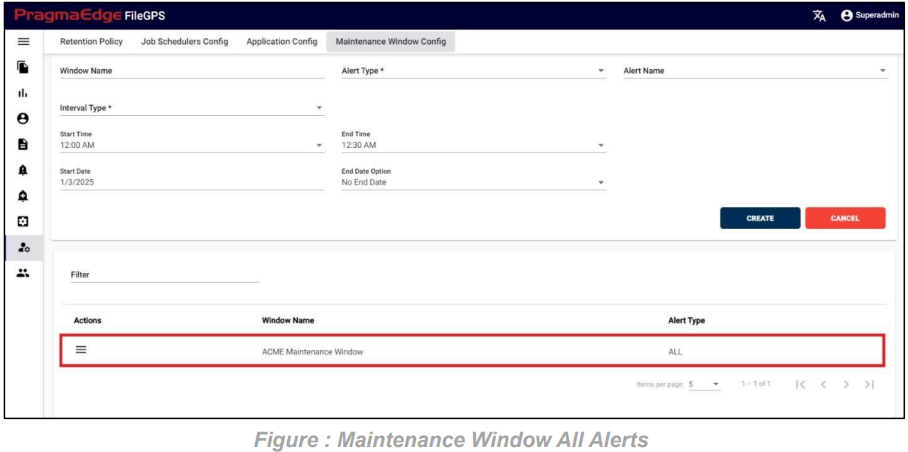
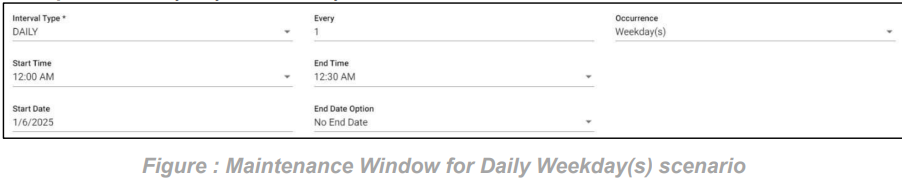
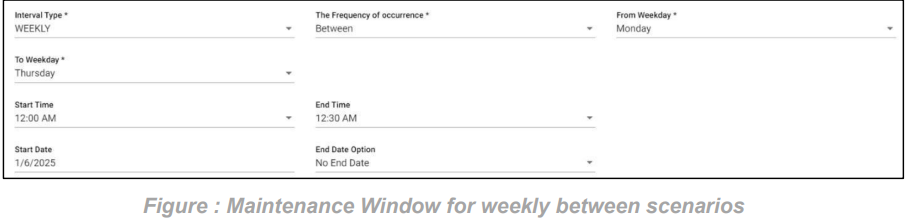
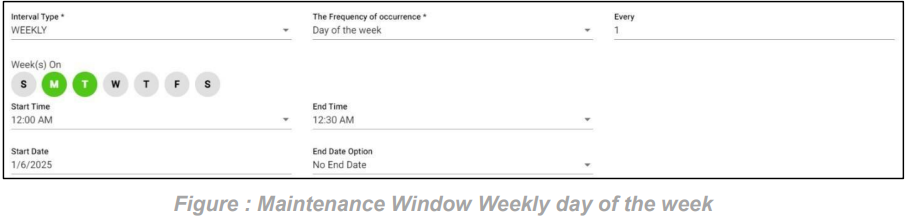
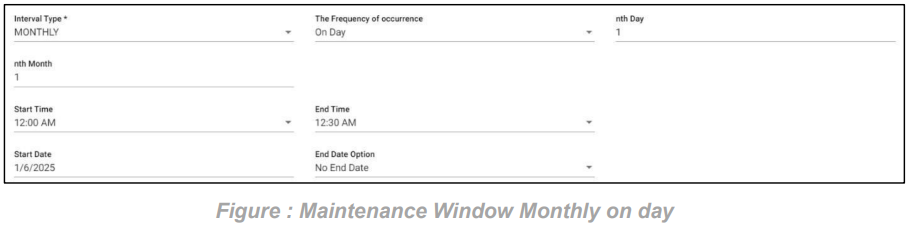
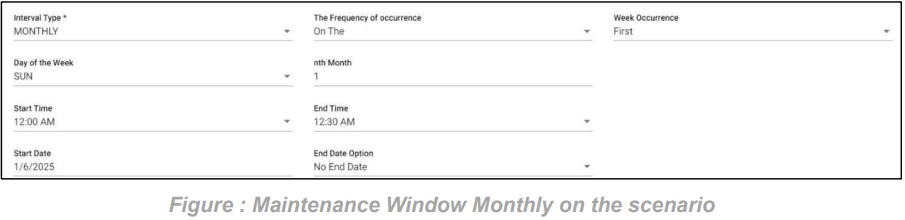
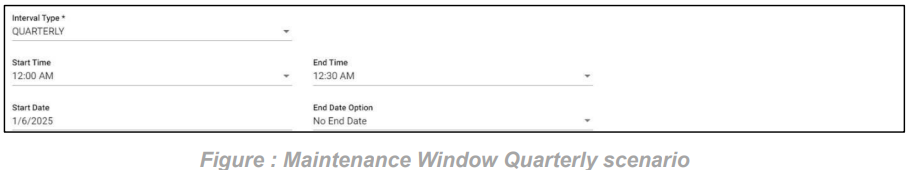
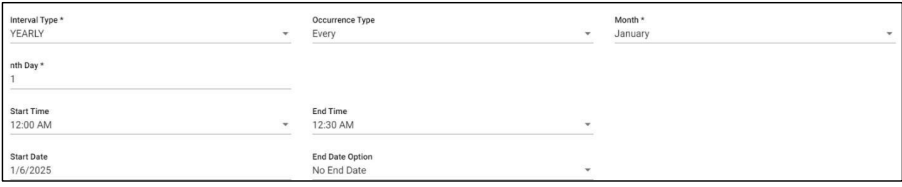
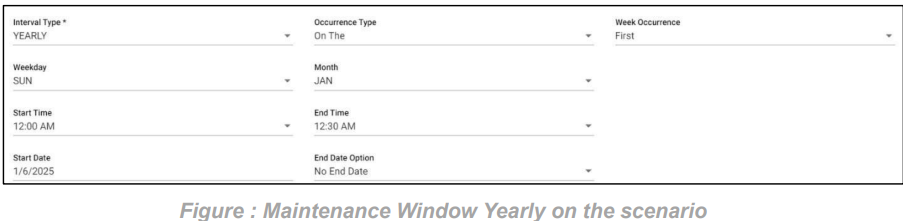
Login Administration Maintenance Window
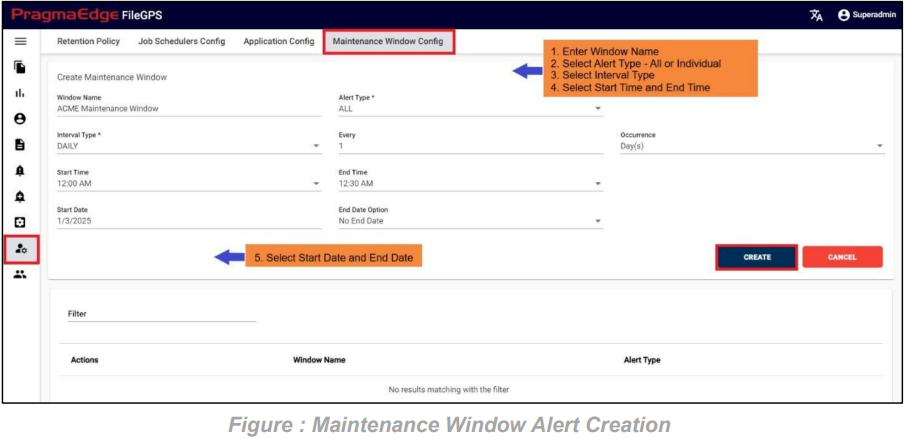
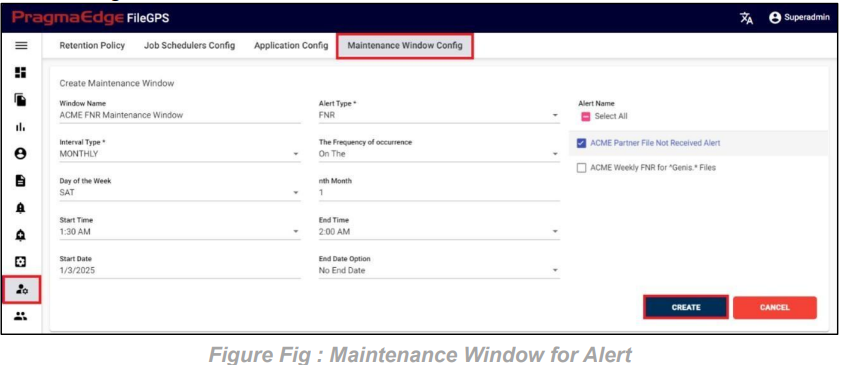
The Maintenance Window enhances the flexibility and efficiency of alert management within the system. This feature allows users to create Maintenance Alerts, which temporarily pause existing alerts during specified time periods.
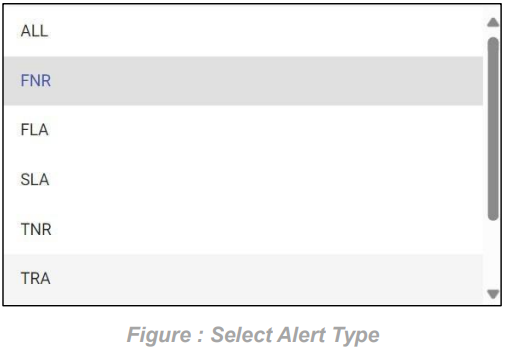
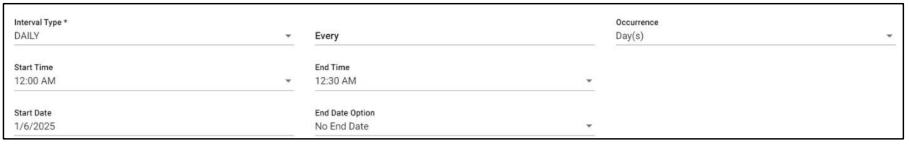
In the Alert Management module, users configure various alerts such as FNR, TNR, SLA and Subscription etc., with defined start dates, end dates, start times, and end times to monitor files or transactions within a specific time window. When a Maintenance Alert is created, it overrides these active alerts for the duration of the maintenance window.
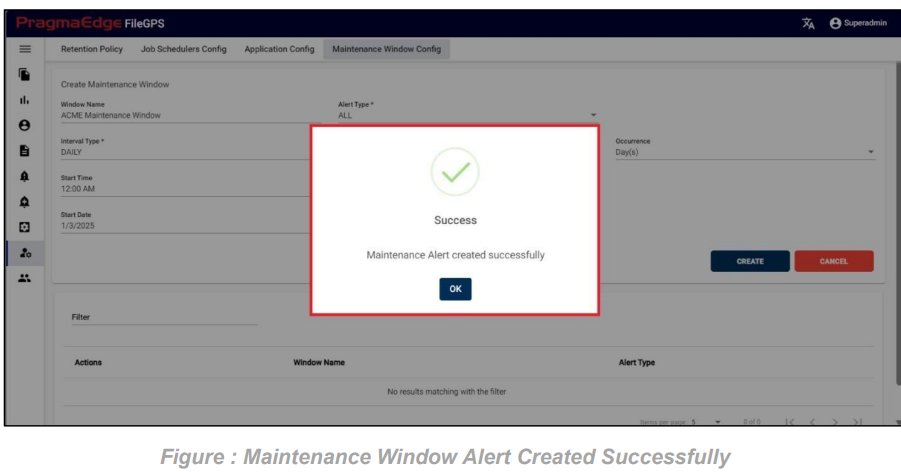
During this time:
• The original alerts are paused.
• The system does not check for files or transactions within the specified time window.
This functionality ensures that the system remains unaffected by scheduled maintenance activities, preventing unnecessary alerts or disruptions during planned downtime.

Path:
Login Access Management
Users can create and manage users, also create and manage groups in this Access Management module. It has four sub modules as follows:
1. Create User
2. Manage User
3. Create Group
4. Manage Group
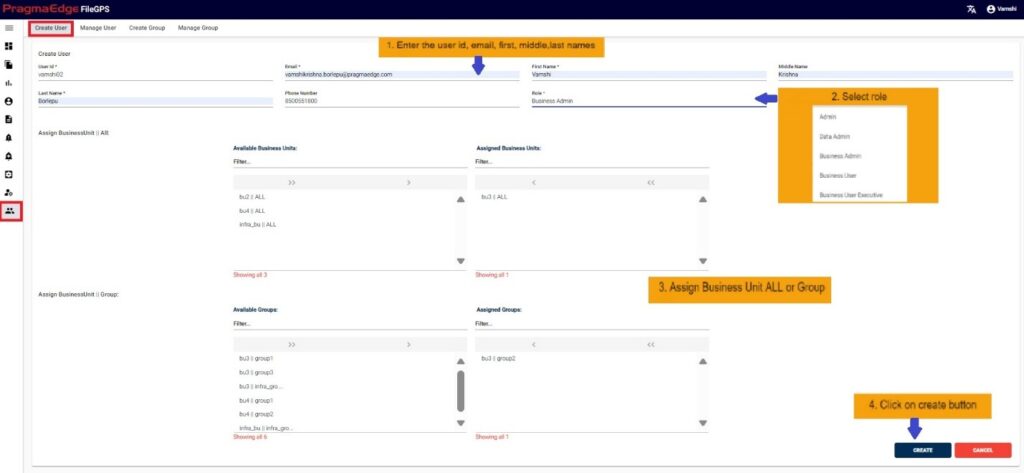
In this screen, we can create various users by giving information about them and by assigning their role and we can also assign business Partners and groups to it.
There are Seven types of users:
1) Super Admin
2) Admin
3) Business Admin
4) Business User
5) Business User Executive
6) Data Admin
7) File Operator
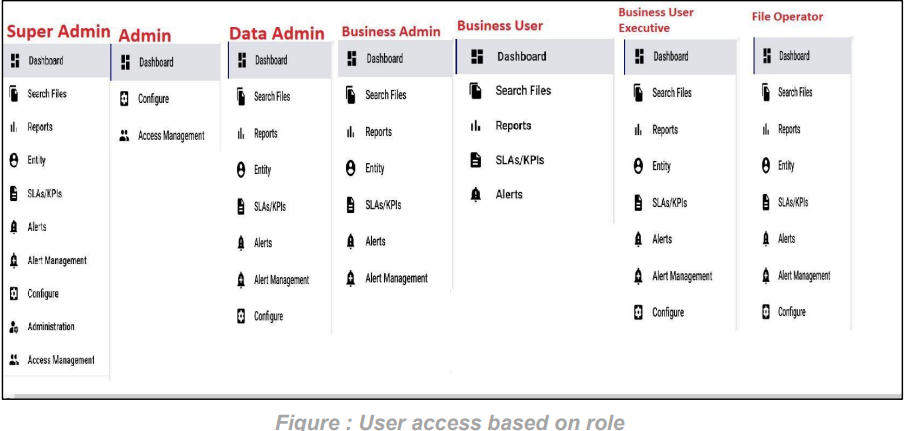
‘Super Admin’ is a privileged user with unrestricted access to the entire application and all its data.
‘Data Admin’ has access to all modules of the application, except the administration, access management module, and can view all data.
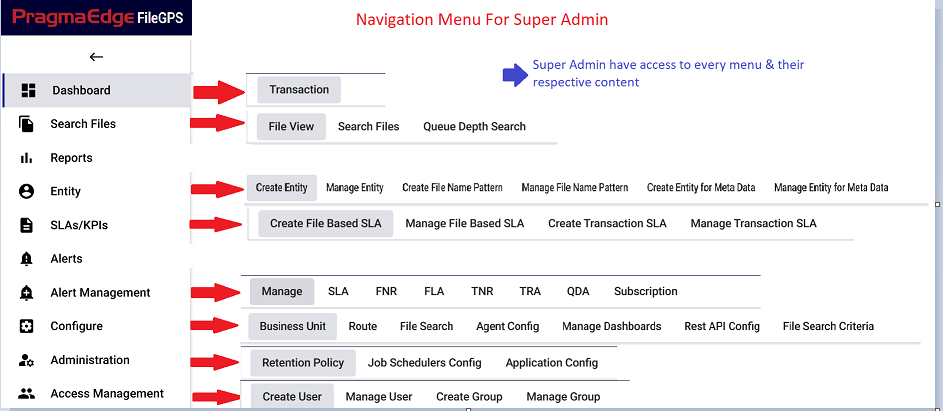
‘Admin’ can create various users such as Admin, Data Admin, Business Admin, Business User and Business User Executive, File Operator and give access privileges to them. He will have access to Dashboard, configure and access management only. However, the access privileges vary hierarchical pattern.
‘Business Admin’ He will have access to the entire application other than configure, administration and access management and can view the data of assigned business units and groups and Un assigned Entities.
‘Business User’ He will have access to Dashboard, Search files, reports, SLAs and Alerts modules and can view the data of assigned business units and Un assigned Entities.
‘Business User Executive’ has access to all modules of the application, except the administration, access management module, can view the data of assigned business units and groups and Un assigned Entities.
‘File Operator’ has access to all modules of the application, except the administration, access management module, can view the data of assigned business units, groups
Path:
Login Access Management Create User
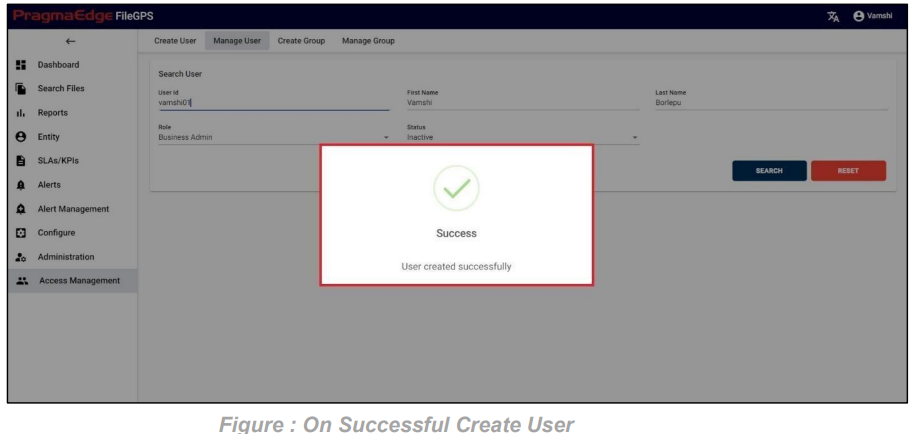
As discussed earlier in this screen we can create user by giving information accordingly. In the below Fig, Admin user has created a User ‘FileGPS User’ and had given access privileges to him.
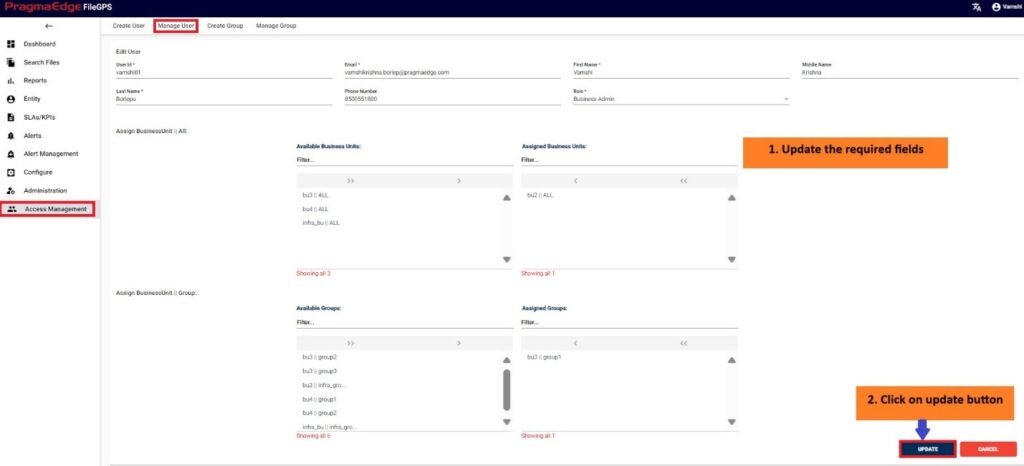
In the Create User Module User can assign two types of Business Units, they are ‘Assign Business Unit All’ and ‘Assign Business Unit Group’. In Assign Business Unit All we can select a particular business unit after clicking on the above single arrow ‘>’ it will assign it to the user we are creating, now this user has access to all the groups in that business unit and all the entities in those groups. Similarly, we have double arrow ‘>>’ by clicking on it will assign all the business units in left section to the user we are creating.
In Assign Business Unit Group, we can select a Business unit Group and then we click on above single arrow ‘>’ to assign it to the user creating, the user has access to all the entities in that group.
Note: If we want to Assign all the business units or all the business unit groups, then we need to click on the above double arrow ‘>>’
Here we are creating a User ‘FileGPS User’ with the role of business admin and had given access privileges to him.
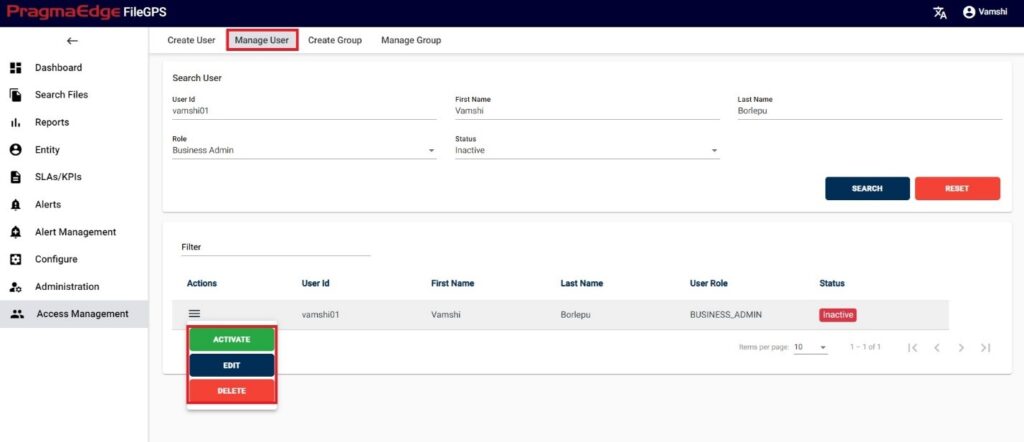
Admin, who has created a user can search the list of created users and provide access privileges to users. Super Admin has the privilege to Activate, Deactivate, update & delete the user.
Path:
Login Access Management Manage User
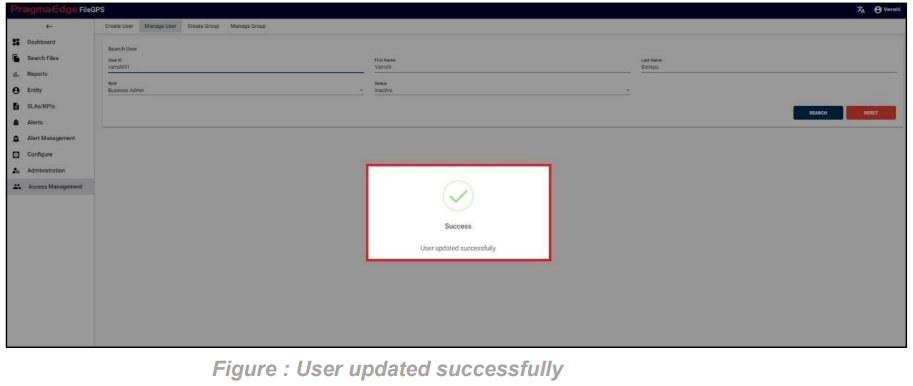
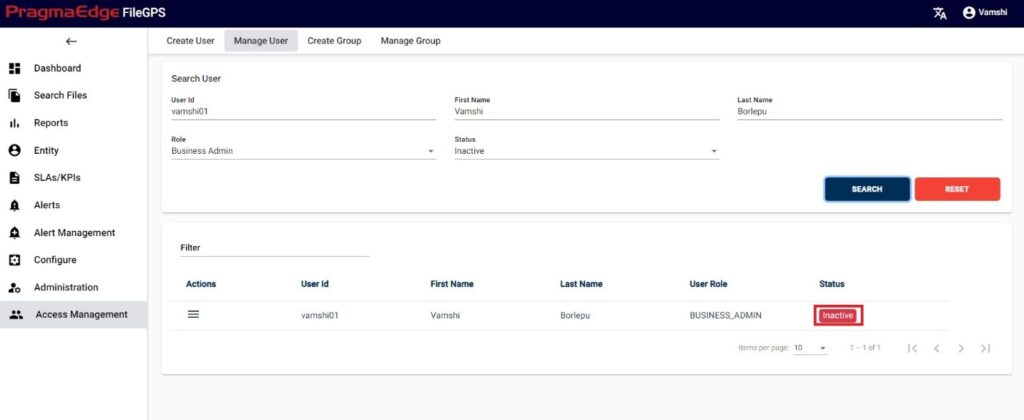
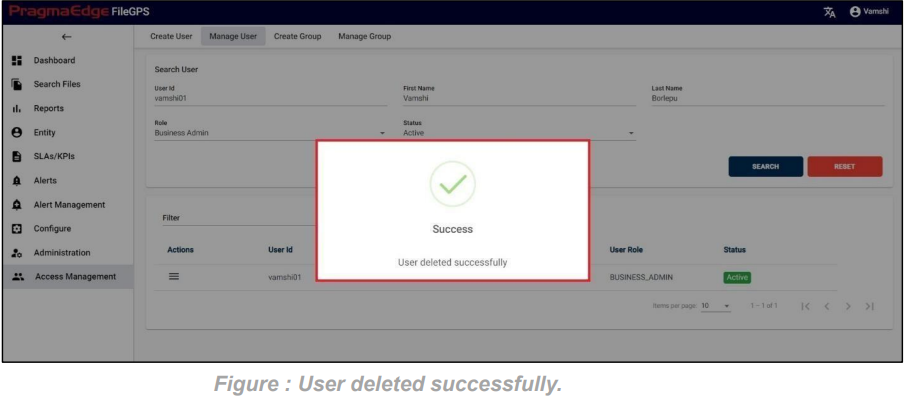
In Manage User Section, Admin have Edit/Delete/Deactivate/Activate options to perform on Users as shown in below figure.

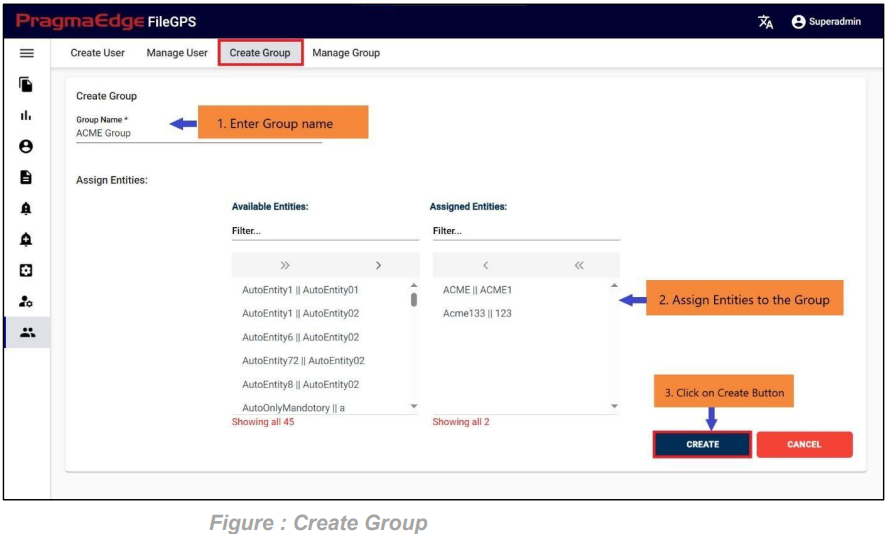
In Create Group, the user creates a Group by assigning Entities to it. So, a group of Entities is nothing but a Group here.
Path:
Login Access Management Create Group
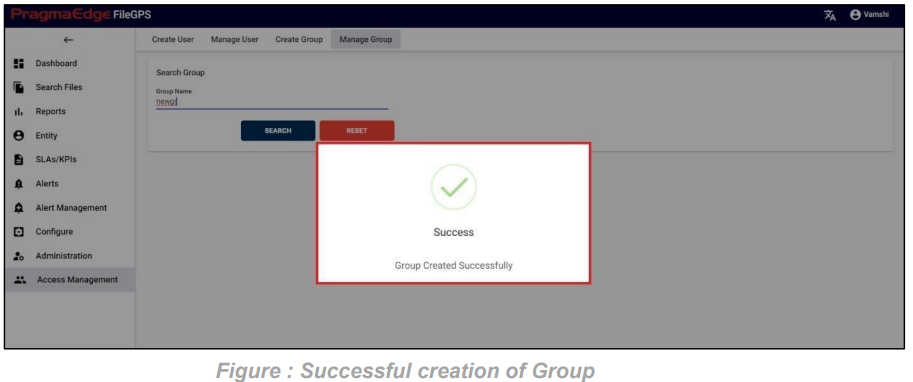
Admin can create user groups in this access management and assign the partners to it. In the below figure admin has configured the Group ‘ACME Group’ for the ACME Entity, Acme133 with Entity ID’s ACME1 and 123 respectively.
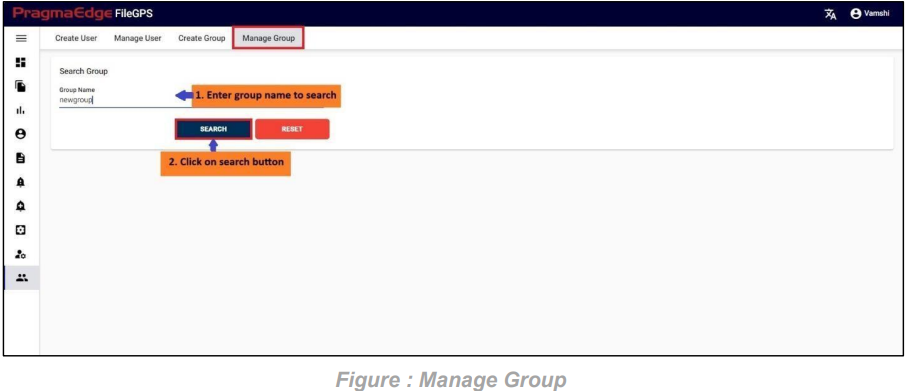
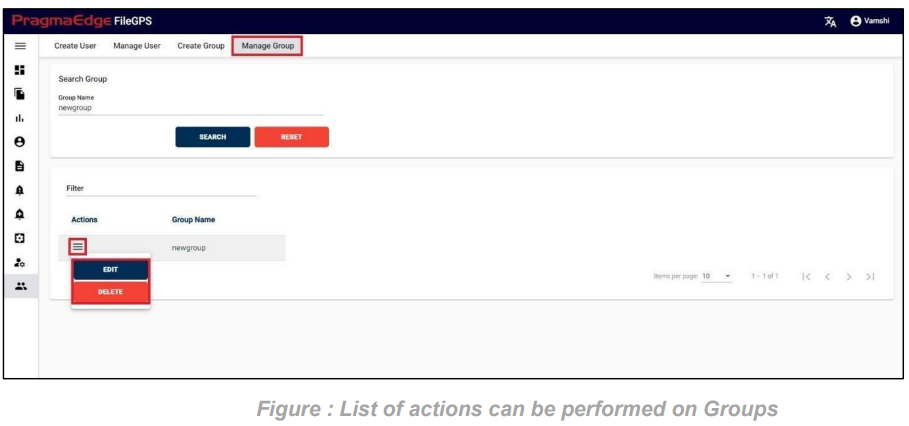
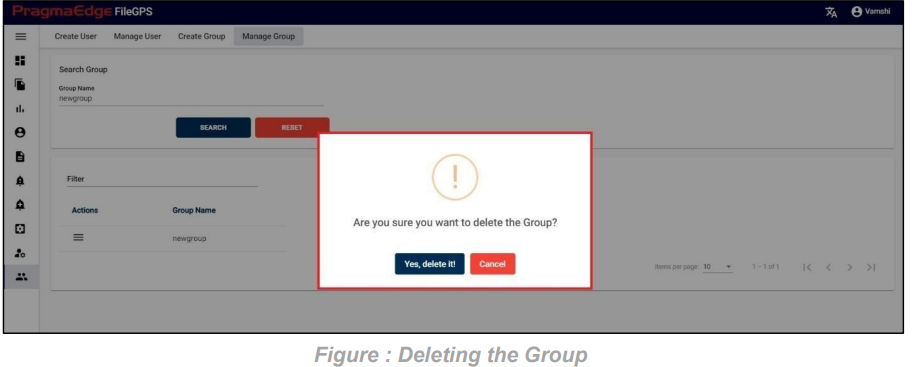
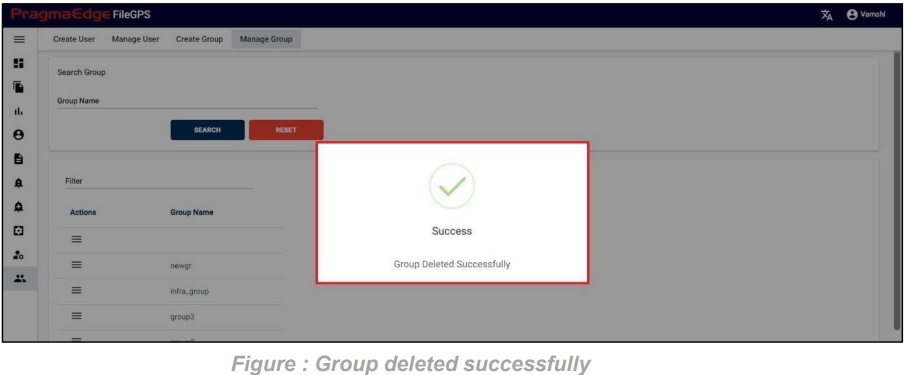
In Manage Group screen, users have edit/delete options to perform on Group.
Path:
Login Access Management Manage Group
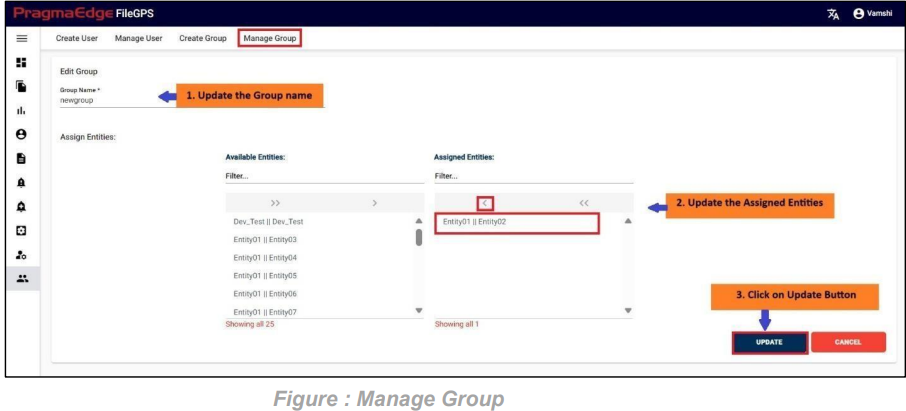
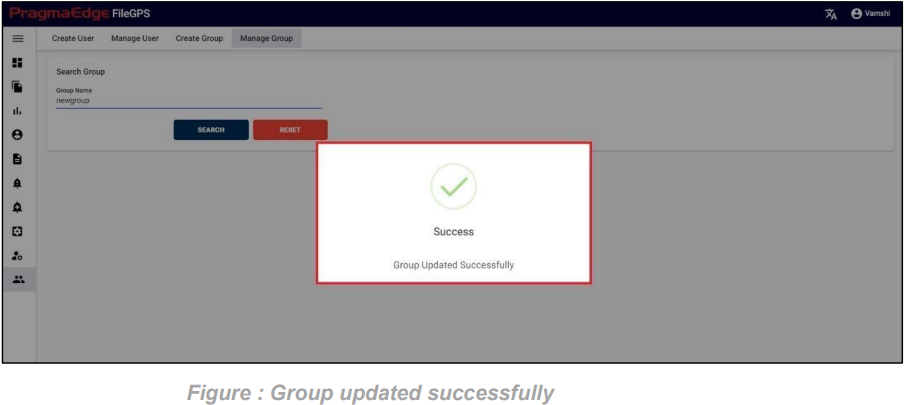
Manage group helps in modifying the details after creation of a group and can delete the groups as shown in Figure below.