IANN Monitor Installation using Helm Charts – 6.3.3
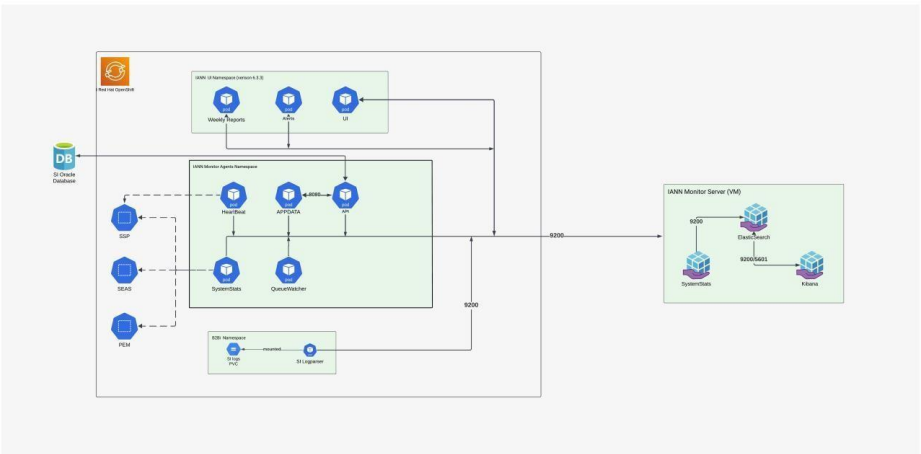
1. Architecture of IANN UI and Monitor in OpenShift
2. Prerequisites for IANN Monitor Deployment in OpenShift
Before proceeding with the installation of the IANN application in an OpenShift cluster, ensure the following prerequisites are in place:
Access to the OpenShift Cluster:
Verify that you have the necessary permissions to access and manage the target OpenShift cluster.IANN Helm Package:
Ensure you have the Helm package required for deploying the IANN application.Container Registry Access:
Obtain the credentials needed to access the container registry that hosts the IANN application images.Access to the IANN Namespace:
Confirm that you have the appropriate permissions to create and manage resources within the designated namespace in the OpenShift cluster.
2.1 Platform Supported Model and Delivery
The IANN application can be deployed on the following platforms:
• RedHat OpenShift Container Platform 4.14
• IBM Cloud
• AWS Cloud
• Azure Cloud
• On-Premises Infrastructure
2.2 Versions
- IANN-agent-6.3.2
- IANN-UI-6.3.2
- ElasticSearch 8.12.2
2.3 Download and Transfer the Helm Package
Start by downloading the IANN Helm package. Transfer the package to a Linux backend that has access to the OpenShift cluster where the deployment will take place. After transferring the package, extract it using the following command:
tar -xvf
2.4 Create a Namespace in OpenShift
Before making any modifications to the Helm charts, it is essential to create a dedicated namespace in the OpenShift cluster for the IANN application. Execute the following command to create the namespace: oc create namespace
2.5 Create an Image Pull Secret
Once the namespace has been created, the next step is to set up an image pull secret. This secret contains the necessary credentials to authenticate with the container registry and pull the required IANN images. Use the following command to create the secret:
oc create secret docker-registry <secret_name> \
–docker-server=<your-registry-server> \
–docker-username=<your-username> \
–docker-password=<your-password> \
-n <namespace>
By completing these steps, you ensure that the OpenShift cluster is properly configured to authenticate with the container registry during the deployment process.
3. Helm Charts Changes
To further customize the deployment, additional changes can be made to the Helm charts. Begin by opening the values.yaml file in a text editor of your choice on the Linux backend.
3.1 Secret file Configuration
- In the root path of the Helm chart, there will be a file named “app-secret.yaml.” Here, we would add the passwords and keep them in secret.
- Please provide the values that need to be kept in the values.yaml file.
- The encrypt-elastic-password and encrypt-queueWatcher-password need to be encrypted from the file that has been shared with you.
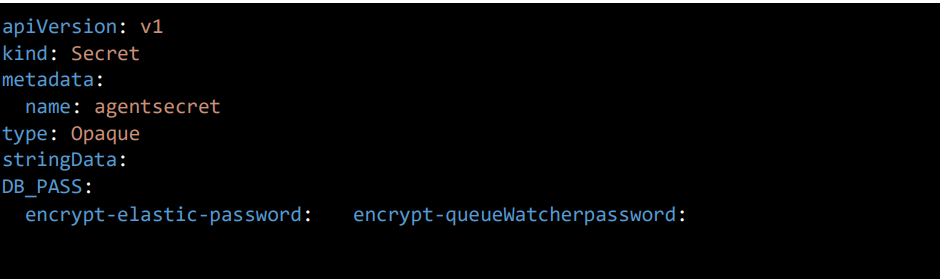
• And apply the file by the command oc apply –f app-secret.yaml to get secrets created
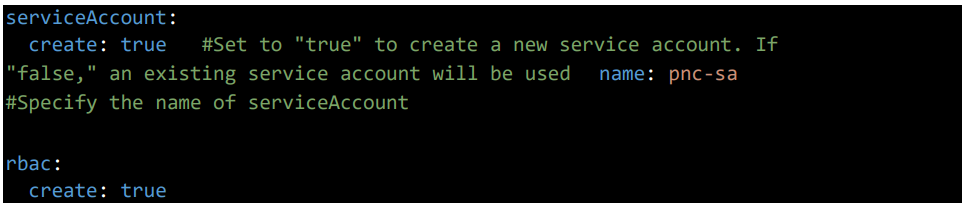
3.2 Service Account Configuration Section
Give the service account name and keep RBAC as true for the permissions that will be applied to the service account.
3.3 Imagepull secret
imagePullSecrets: Refers to the secret used for pulling images from the container registry. Replace the “test” with your actual secret name
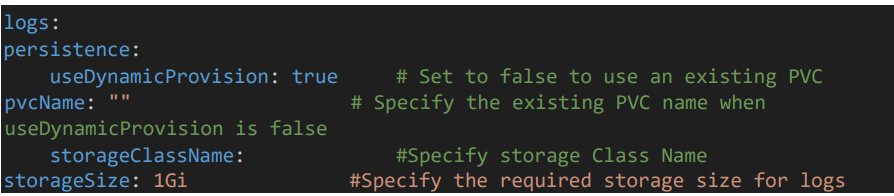
3.4 Log Configuration Section
For storing logs give the storage class name and required storage size
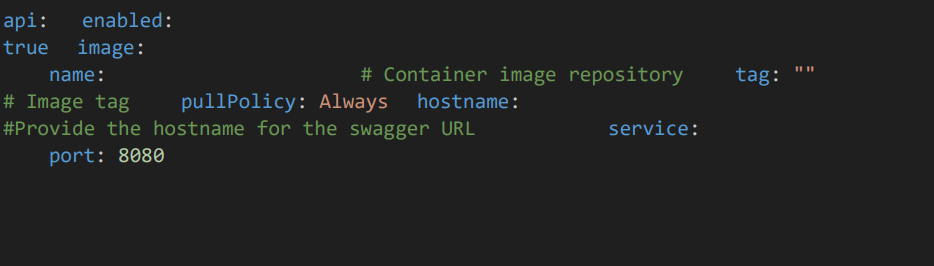
3.5 Api Pod Configuration
• Give the agent image name, tag.
• Give hostname for the swagger URL. Default service port is 8080, you can change as required
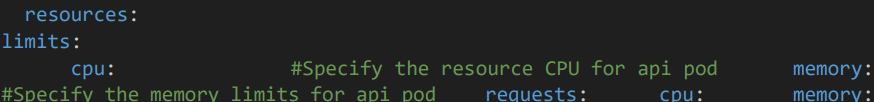
3.6 Api pod resource configuration
Give the resource CPU and memory limits for API pod.
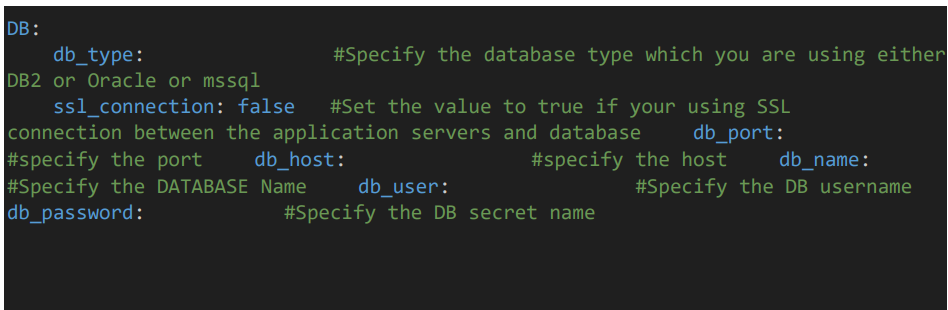
3.7 Database details
• Provide the DB details of the Sterling Integrator.
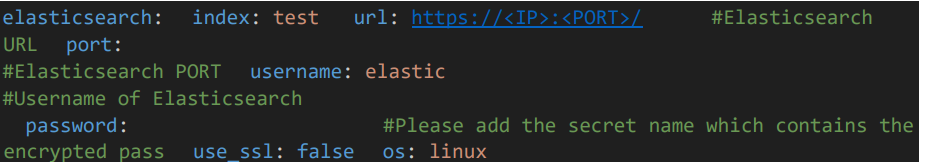
3.8 Elastic Search Configuration
- Provide the Elasticsearch details such as URL, port, username, and secret name which contains the password.
- Additionally, specify the index name, which must be unique.
3.9 App data Configuration
- To enable deployment of the appdata pod, set ‘enable’ to ‘true’ and specify the Beat configurations you want the appdata pod to monitor.
- db_type: Specifies the DB type.
- scheduled_seconds: Defines a default time interval (300 seconds) for scheduled tasks or operations.
- Waiting_count_version: Set waiting count version to true if SI version is 6.2.0 for waiting counts, else false.
- Halted_count_version: Set halted count version to true if SI version is 6.2.0, else false.
- list: List of directories or file paths related to the application that need to be ignored while checking for mailbox depth.
- service_list: A list of services that the application will monitor or interact with.
- mailbox_long_running_morethan_mins: 30 – Tracks mailbox processes that have been running for more than 30 minutes.
- adapter_list: A list of various adapters (e.g., REST Http Server Adapter, SMTP Send Adapter) used for different integrations or communication protocols.
- schedulers_list: A list of scheduler jobs or tasks.
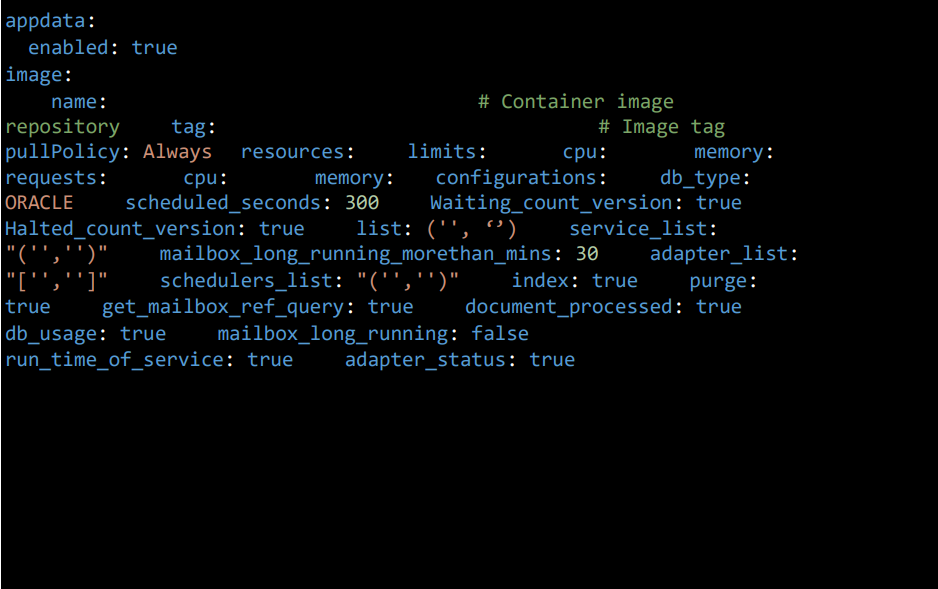
- archive: Set to true/false to activate/inactivate the tracking of Archive counts.
- index: Set to true/false to activate/inactivate the tracking of index counts.
- purge: Set to true/false to activate/inactivate the tracking of purge counts.
- get_mailbox_ref_query: Set to true/false to activate/inactivate the tracking of Mailbox depth.
- document_processed: Set to true/false to activate/inactivate the tracking of Documents processed.
- db_usage: Set to true/false to activate/inactivate the tracking of SI DB Usage.
- mailbox_long_running: Set to true/false to activate/inactivate the tracking of mailbox long running.
- run_time_of_service: Set to true/false to activate/inactivate the tracking of Service run time.
- adapter_status: Set to true/false to activate/inactivate the tracking of Adapter status.
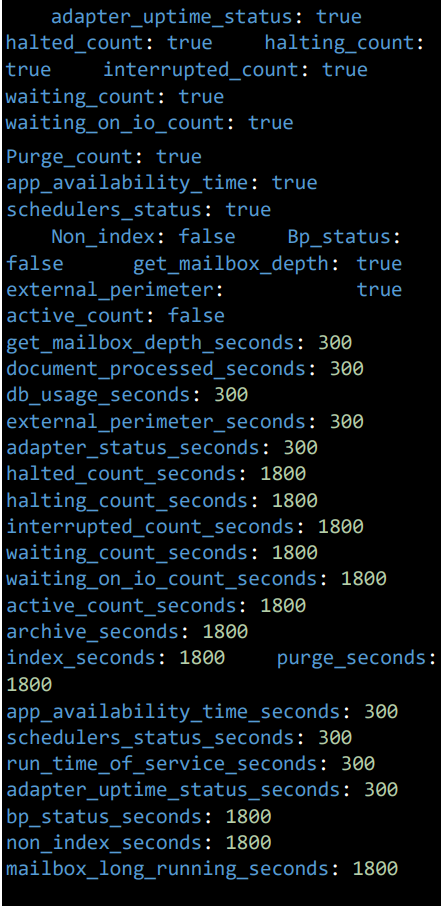
- adapter_uptime_status: Set to true/false to activate/inactivate the tracking of uptime of adapters.
- halted_count: Set to true/false to activate/inactivate the tracking of Halted BP count.
- halting_count: Set to true/false to activate/inactivate the tracking of Halting BP count.
- interrupted_count: Set to true/false to activate/inactivate the tracking of interrupted BP count.
- waiting_count: Set to true/false to activate/inactivate the tracking of Waiting BP count.
- waiting_on_io_count: Set to true/false to activate/inactivate the tracking of Waiting on IO BP count.
- purge_count: Set to true/false to activate/inactivate the tracking of Purge Count.
- app_availability_time: Set to true/false to activate/inactivate the tracking of SI Application uptime.
- schedulers_status: Set to true/false to activate/inactivate the tracking of Schedulers status.
- non_index: Set to true/false to activate/inactivate the tracking of non-indexed data.
- bp_status: Set to true/false to activate/inactivate the tracking of BP status data.
- get_mailbox_depth: Set to true/false to activate/inactivate the tracking of mailbox depth data.
- external_perimeter: Set to true/false to activate/inactivate the tracking of Perimeter server status data.
- active_count: Set to true/false to activate/inactivate the tracking of Active BP counts data.
NOTE: Each metric or data point here is in seconds and can have its own collection frequency.
- get_mailbox_depth_seconds: 300 – Tracks mailbox depth every 300 seconds (5 minutes).
- document_processed_seconds: 300 – Tracks processed documents every 300 seconds (5 minutes).
- db_usage_seconds: 300 – Tracks database usage every 300 seconds (5 minutes).
- external_perimeter_seconds: 300 – Tracks external perimeter data every 300 seconds.
- adapter_status_seconds: 300 – Tracks adapter status every 300 seconds (5 minutes).
- halted_count_seconds: 1800 – Tracks halted counts every 1800 seconds (30 minutes).
- halting_count_seconds: 1800 – Tracks halting counts every 1800 seconds.
- interrupted_count_seconds: 1800 – Tracks interrupted counts every 1800 seconds.
- waiting_count_seconds: 1800 – Tracks waiting counts every 1800 seconds.
- waiting_on_io_count_seconds: 1800 – Tracks waiting-on-IO counts every 1800 seconds.
- active_count_seconds: 1800 – Tracks active counts every 1800 seconds.
- archive_seconds: 1800 – Tracks archive operations every 1800 seconds.
- index_seconds: 1800 – Tracks index operations every 1800 seconds.
- purge_seconds: 1800 – Tracks purge operations every 1800 seconds.
- app_availability_time_seconds: 300 – Tracks application availability time every 300 seconds.
- schedulers_status_seconds: 300 – Tracks scheduler status every 300 seconds.
- run_time_of_service_seconds: 300 – Tracks service run time every 300 seconds.
- adapter_uptime_status_seconds: 300 – Tracks adapter uptime every 300 seconds.
- bp_status_seconds: 1800 – Tracks BP status every 1800 seconds.
- non_index_seconds: 1800 – Tracks non-index data every 1800 seconds.
- mailbox_long_running_seconds: 1800 – Tracks long-running mailbox processes every 1800 seconds.
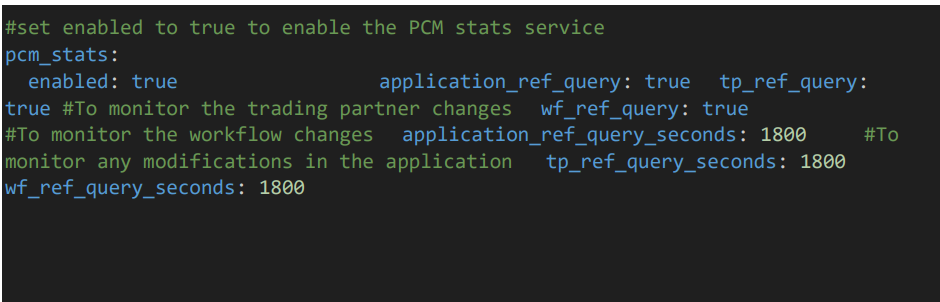
3.10 PCM Stats Service Configuration
- enabled: true – Enables the PCM stats service.
- application_ref_query: Set to true/false to activate/inactivate the tracking of PCM Application activity data.
- tp_ref_query: Set to true/false to activate/inactivate the tracking of PCM Trading Partner activity data.
- wf_ref_query: Set to true/false to activate/inactivate the tracking of PCM Workflow activity data.
application_ref_query_seconds: 300
Specifies that application reference queries should be tracked every 300 seconds (5 minutes).
tp_ref_query_seconds: 300
Specifies that transaction point reference queries should be tracked every 300 seconds (5 minutes).
wf_ref_query_seconds: 300
Specifies that workflow reference queries should be tracked every 300 seconds (5 minutes).
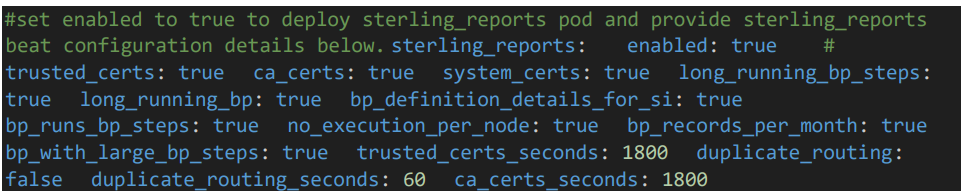
3.11 Sterling Reports Pod Configuration
This section configures the deployment of the Sterling Reports pod, which provides detailed reporting and monitoring for the Sterling application. These reports cover various aspects such as certificate status, long-running business processes, and more.
- enabled: Set this to “true” to deploy the Sterling Reports pod. If set to “false”, the Sterling Reports pod will not be deployed.
- trusted_certs: Set this to “true” to enable monitoring and reporting of trusted certificates. This helps track certificates that are considered trusted by the system.
- ca_certs: Set this to “true” to enable monitoring and reporting of Certificate Authority (CA) certificates. These are certificates used to verify the authenticity of other certificates.
- system_certs: Set this to “true” to enable monitoring and reporting of system certificates. These certificates are used for internal communication and ensuring secure connections.
- long_running_bp_steps: Set this to “true” to track long-running business process (BP) steps. This will help identify steps that take longer than expected, which could indicate potential issues or inefficiencies.
- long_running_bp: Set this to “true” to track long-running business processes as a whole. This helps identify processes that may be stuck or taking too long to complete.
- bp_definition_details_for_si: Set this to “true” to enable reporting on business process (BP) definition details specifically for Sterling Integrator (SI). This will provide insights into the structure of BPs in SI.
- bp_runs_bp_steps: Set this to “true” to enable tracking of BP steps executed during BP runs. This provides granular details about the execution of BP steps.
- no_execution_per_node: Set this to “true” to monitor nodes with no executions. This can help identify idle nodes or potential issues with node execution.
- bp_records_per_month: Set this to “true” to track the number of business process records generated per month. This can help with performance analysis and capacity planning.
- bp_with_large_bp_steps: Set this to “true” to identify business processes that involve large BP steps. These large steps can impact performance and need monitoring.
- trusted_certs_seconds: Define the interval, in seconds, for checking and reporting on trusted certificates. For example, “1800” means the check will run every 30 minutes.
- duplicate_routing: Set this to “false” to disable monitoring of duplicate routing. This can be enabled if duplicate routing in your system needs to be tracked.
- duplicate_routing_seconds: Define the interval, in seconds, for checking duplicate routing. If set to “60”, the check will run every minute.
- ca_certs_seconds: Define the interval, in seconds, for checking CA certificates. For example, “1800” means the check will run every 30 minutes.
- system_certs_seconds: Define the interval, in seconds, for checking system certificates. Again, “1800” means the check will run every 30 minutes.
- long_running_bp_steps_seconds: Define the interval, in seconds, for checking long-running business process steps. For example, “900” means the check will run every 15 minutes.
- long_running_bp_seconds: Define the interval, in seconds, for checking long-running business processes. Setting this to “1800” means the check will run every 30 minutes.

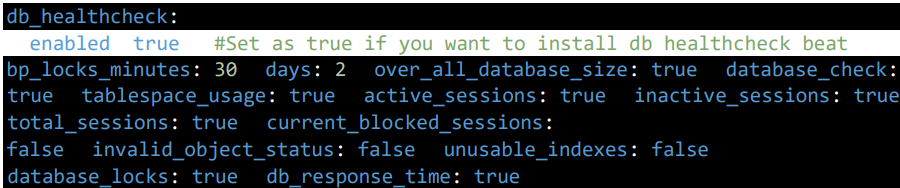
3.12 DB Healthcheck Configuration
This section configures the deployment of the DB healthcheck.
- bp_locks_minutes: 30 — Specifies the threshold for business process (BP) locks monitoring (locks older than 30 minutes are flagged).
- days: 2 — Specifies the number of days for certain data points, like extraction and message age checks (e.g., checks for unextracted messages older than 2 days).
- over_all_database_size: Set to true/false to activate/inactivate the tracking of the overall database size.
- database_check: Set to true/false to activate/inactivate the tracking of database status.
- tablespace_usage: Set to true/false to activate/inactivate the tracking of tablespace usage.
- active_sessions: Set to true/false to activate/inactivate the tracking of active database sessions.
- inactive_sessions: Set to true/false to activate/inactivate the tracking of inactive database sessions.
- total_sessions: Set to true/false to activate/inactivate the tracking of the total number of database sessions.
- current_blocked_sessions: Set to true/false to activate/inactivate the tracking of currently blocked sessions.
- invalid_object_status: Set to true/false to activate/inactivate the tracking of invalid objects within the database.
- unusable_indexes: Set to true/false to activate/inactivate the tracking of unusable indexes in the database.
- database_locks: Set to true/false to activate/inactivate the tracking of database locks.
- db_response_time: Set to true/false to activate/inactivate the tracking of database response time.
This section configures additional database health check parameters.
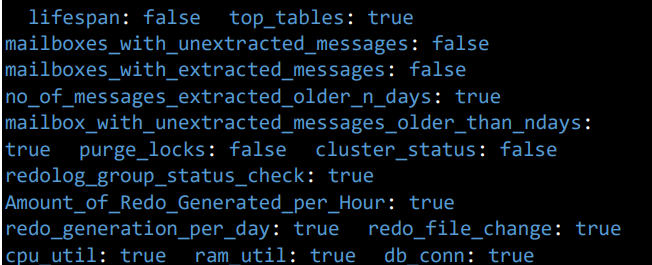
- lifespan: Set to true/false to activate/inactivate the tracking of the lifespan of database components.
- top_tables: Set to true/false to activate/inactivate the tracking of top tables by usage.
- mailboxes_with_unextracted_messages: Set to true/false to activate/inactivate the tracking of mailboxes with unextracted messages.
- mailboxes_with_extracted_messages: Set to true/false to activate/inactivate the tracking of mailboxes with extracted messages.
- no_of_messages_extracted_older_n_days: Set to true/false to activate/inactivate the tracking of messages extracted older than a specified number of days.
- mailbox_with_unextracted_messages_older_than_ndays: Set to true/false to activate/inactivate the tracking of mailboxes with unextracted messages older than a specified number of days.
- purge_locks: Set to true/false to activate/inactivate the tracking of purge locks in the database.
- cluster_status: Set to true/false to activate/inactivate the tracking of cluster status.
- redolog_group_status_check: Set to true/false to activate/inactivate the tracking of redo log groups. This parameter is used for Oracle databases.
- Amount_of_Redo_Generated_per_Hour: Set to true/false to activate/inactivate the tracking of the amount of redo generated per hour. This parameter is used for Oracle databases.
- redo_generation_per_day: Set to true/false to activate/inactivate the tracking of redo generation per day. This parameter is used for Oracle databases.
- redo_file_change: Set to true/false to activate/inactivate the tracking of redo file changes. This parameter is used for Oracle databases.
- cpu_util: Set to true/false to activate/inactivate the tracking of CPU utilization.
- ram_util: Set to true/false to activate/inactivate the tracking of RAM utilization.
- db_conn: Set to true/false to activate/inactivate the tracking of database connections.
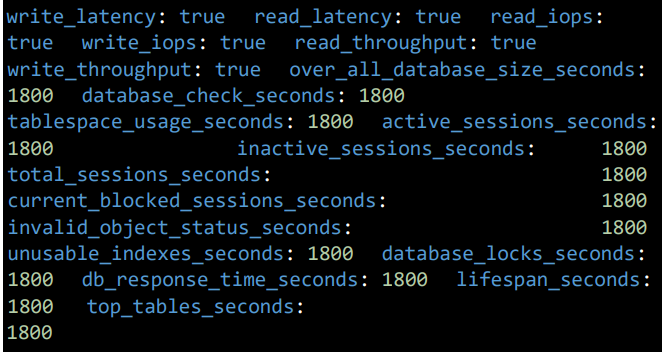
Database Performance and Health Check Configuration:
- write_latency: Set to true/false to activate/inactivate the tracking of write latency.
- read_latency: Set to true/false to activate/inactivate the tracking of read latency.
- read_iops: Set to true/false to activate/inactivate the tracking of read I/O operations per second (IOPS).
- write_iops: Set to true/false to activate/inactivate the tracking of write I/O operations per second (IOPS).
- read_throughput: Set to true/false to activate/inactivate the tracking of read throughput (amount of data read).
- write_throughput: Set to true/false to activate/inactivate the tracking of write throughput (amount of data written).
Frequency Settings (in seconds):
- over_all_database_size_seconds: 1800 – Frequency for tracking overall db size
- database_check_seconds: 1800 – Frequency for performing a database health check
- tablespace_usage_seconds: 1800 – Frequency for tracking tablespace usage
- active_sessions_seconds: 1800 – Frequency for monitoring active sessions
- inactive_sessions_seconds: 1800 – Frequency for monitoring inactive sessions
- total_sessions_seconds: 1800 – Frequency for tracking total sessions
- current_blocked_sessions_seconds: 1800 – Frequency for tracking blocked sessions
- invalid_object_status_seconds: 1800 – Frequency for checking invalid object status
- unusable_indexes_seconds: 1800 – Frequency for monitoring unusable indexes
- database_locks_seconds: 1800 – Frequency for tracking database locks
- db_response_time_seconds: 1800 – Frequency for tracking database response time
- lifespan_seconds: 1800 – Frequency for tracking lifespan
- top_tables_seconds: 1800 – Frequency for tracking top tables
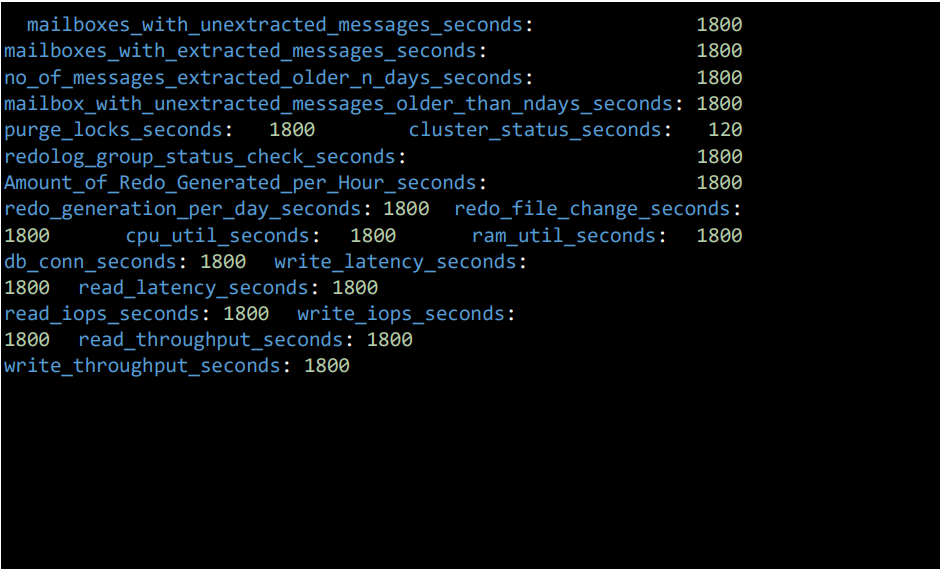
Mailbox and Database Monitoring Configuration:
- mailboxes_with_unextracted_messages_seconds: 1800 – Frequency for tracking mailboxes with unextracted messages
- mailboxes_with_extracted_messages_seconds: 1800 – Frequency for tracking mailboxes with extracted messages
- no_of_messages_extracted_older_n_days_seconds: 1800 – Frequency for tracking the number of messages extracted older than specified days
- mailbox_with_unextracted_messages_older_than_ndays_seconds: 1800 – Frequency for tracking mailboxes with unextracted messages older than specified days
- purge_locks_seconds: 1800 – Frequency for monitoring purge locks
- cluster_status_seconds: 120 – Frequency for monitoring cluster status
- redolog_group_status_check_seconds: 1800 – Frequency for checking redo log group status
- Amount_of_Redo_Generated_per_Hour_seconds: 1800 – Frequency for tracking amount of redo generated per hour
- redo_generation_per_day_seconds: 1800 – Frequency for tracking redo generation per day
- redo_file_change_seconds: 1800 – Frequency for tracking redo file changes
- cpu_util_seconds: 1800 – Frequency for monitoring CPU utilization
- ram_util_seconds: 1800 – Frequency for monitoring RAM utilization
- db_conn_seconds: 1800 – Frequency for tracking database connections
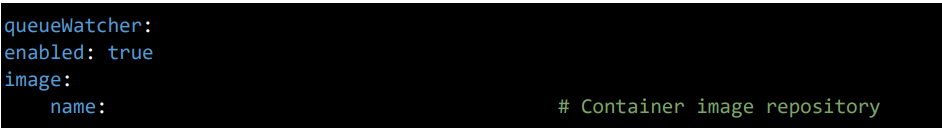
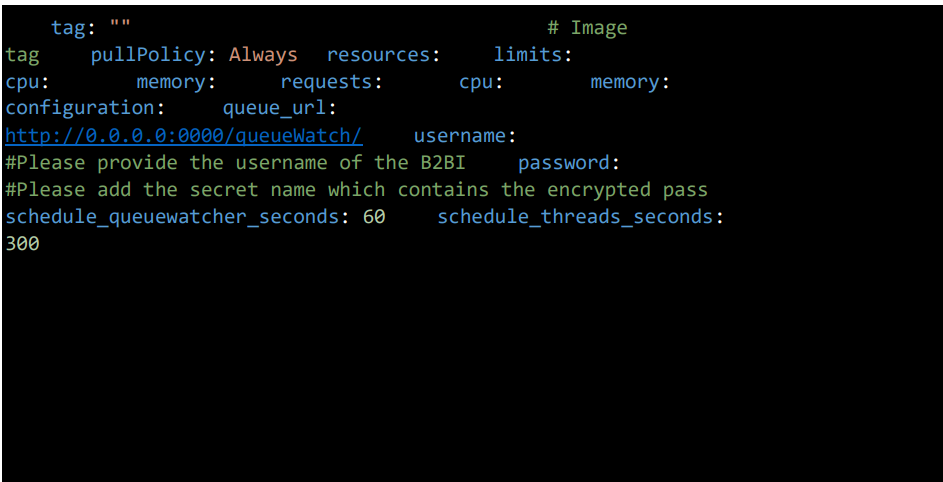
3.13 Queuewatcher Configuration
enabled: true – Enables the QueueWatcher service. queue_url: Provide the B2BI QueueWatcher
Service URL (HTTP) schedule_queuewatcher_seconds: 60 Defines the schedule interval (in seconds) for the QueueWatcher to check or interact with the queue.
schedule_threads_seconds: 300
Defines the schedule interval (in seconds) for thread monitoring related to the queue
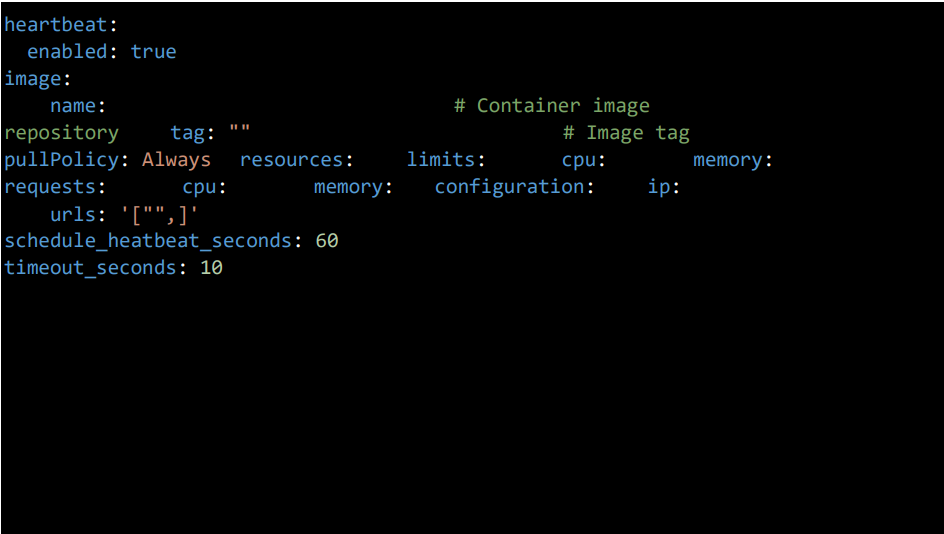
3.14 Heartbeat Pod Configuration
This section configures the deployment of the Heartbeat pod, which monitors the availability and responsiveness of specified IPs and URLs. It helps ensure that key services and endpoints are operational and responding within defined time limits.
General Settings
• enabled: Set to true to enable heartbeat monitoring.
Image Configuration
• name: Container image repository.
• tag: Image version (leave empty for latest).
• pullPolicy: Always (or IfNotPresent).
Resource Configuration
• limits: Define CPU and memory limits.
• requests: Define minimum CPU and memory requests.
Heartbeat Parameters
• ip: IP address to monitor.
• urls: List of URLs to monitor (e.g., [“http://example.com“]).
• schedule_heatbeat_seconds: Interval between checks (default: 60).
• timeout_seconds: Timeout for each check (default: 10).
3.15 SSP Configuration
This section monitors the ssp engine adapters. enabled: Set to true to enable SSP.
data: Provide the required data in JSON format. For example, {“Test Engine1 Adapters1”:[“0.0.0.0”,0000]}.

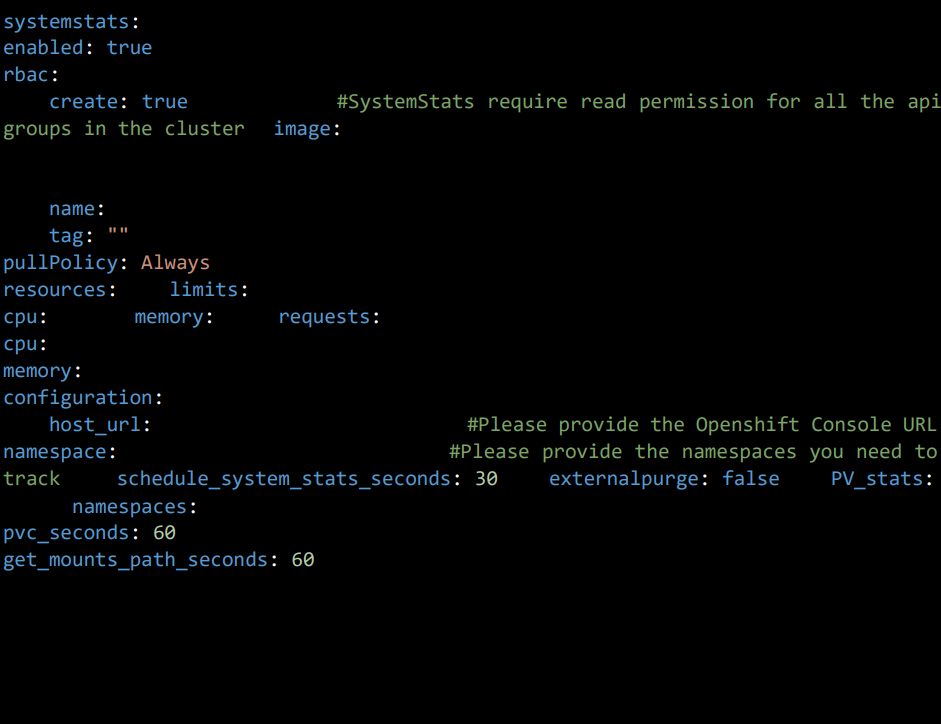
3.16 Systemstats Pod Configuration
This section monitors all the pods,nodes health status in the OpenShift Cluster and send that to elasticsearch.
3.17 Save file and install application
• After updating all the values in values.yml we need to install the helm which deploys all the resources in templates file.
• Save the values.yaml file.
• To install the helm chart: helm install -f <path/to/helmchart>
• To upgrade the helm chart: helm upgrade -f <path/to/helmchart>
• To roll back the helm chart by giving revision number: helm rollback